The Inconceivability of the CLPM and RI-CLPM

Written by Brent Roberts and not ChatGTP. Really*

The existence of an observational scientist can be a frustrating affair. Relegated to second class citizen status due to interest in phenomena that can’t be easily manipulated (e.g., marital satisfaction; extraversion), we often covet the status given so readily to those who wield causal methods. This is one of the primary reasons we obsess over the niceties of longitudinal cross-lagged models. What observational researcher hasn’t said in the discussion section of a study reporting a string of cross-sectional mediation models that what is desperately needed next is a longitudinal study? Not only a longitudinal study, but one that would seemingly lend itself to some form of causal inference? Enter the Cross-Lag Panel Model (CLPM), the Random-Intercept Cross-Lag Panel Model (RI-CLPM) or the granddaddy of them all, the Autoregressive Latent Trajectory model with Structured Residuals (ALT-SR). Certainly, given how fancy these models get, the observational scientist is well on their way to their coveted causal inference, right?

Not really. But we’ll get to that.

The first two models have, of late, been the source of ongoing debates mostly focused on the technical details of what the CLPM and RI-CLPM can tell us (Hamaker, 2023; Lucas, 2023; Lucas, Weidmann, & Brandt, 2025; Orth et al., 2021; Schimmack, 2020). In the current zeitgeist, most folks advocate for eliminating the CLPM (e.g., Lucas, 2023; Schimmack, 2020) and yet a hearty minority are sticking to their CLPM guns (e.g., Orth et al., 2021). 

What has been ignored is whether either model actually tests anything we want to test and if so whether it does so well enough to justify the heat and light. There are a host of issues that the debates about the CLPM and RI-CLPM have overlooked, that I believe are just as fundamental to whether you should be using these models.  

I thought it best to go at these issues using a softer approach than the typical airing of grievances. Therefore, gather round the Festivus pole and let me ask you, cross-lag model users, some questions. These questions are meant for my friends who continue to employ these models, whether you are the “I’m only interested in between-person variance CLPMer” or the “CLPM is evil and bad therefore I use the RI-CLPMer” or the just plain fancy pants quant jock who wields the ALT-SR like a bludgeon. And, don’t get me wrong, I am a co-author on papers that employ these models (e.g. Davis et al., 2017; Rieger et al., 2016). But I would like to note, my thinking about these models has changed with time and I now have a different perspective on their value.

Just to remind you, here’s the typical CLPM:

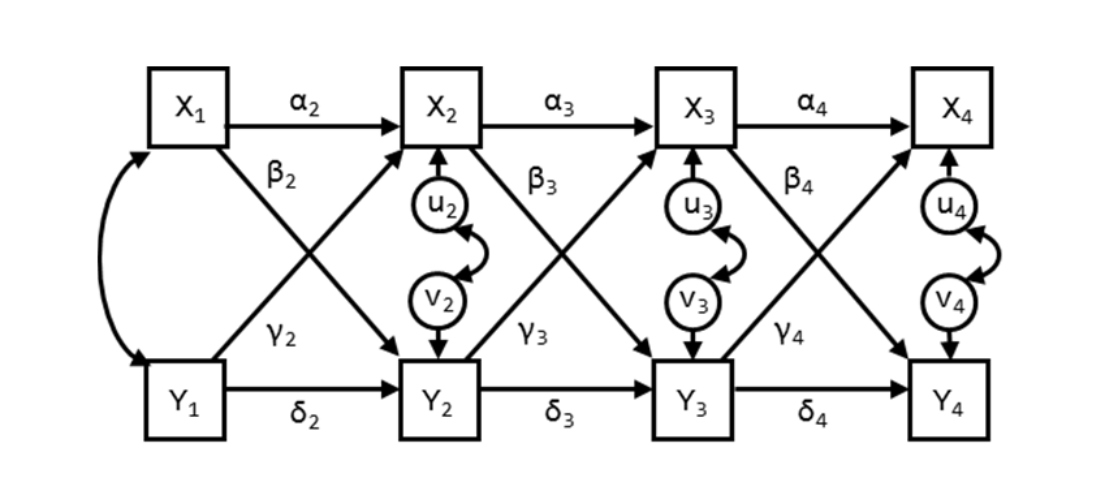
Using either latent or manifest variables, we estimate the autoregressive functions (e.g., stability or the α’s and the δ’s above), while simultaneously estimating the γ’s and β’s, or the cross lags. Interestingly, and something I’ll come back to later, the full model also includes those bothersome cross-sectional correlations between the residuals. 

The RI-CLPM is a not so simple variant of this model:

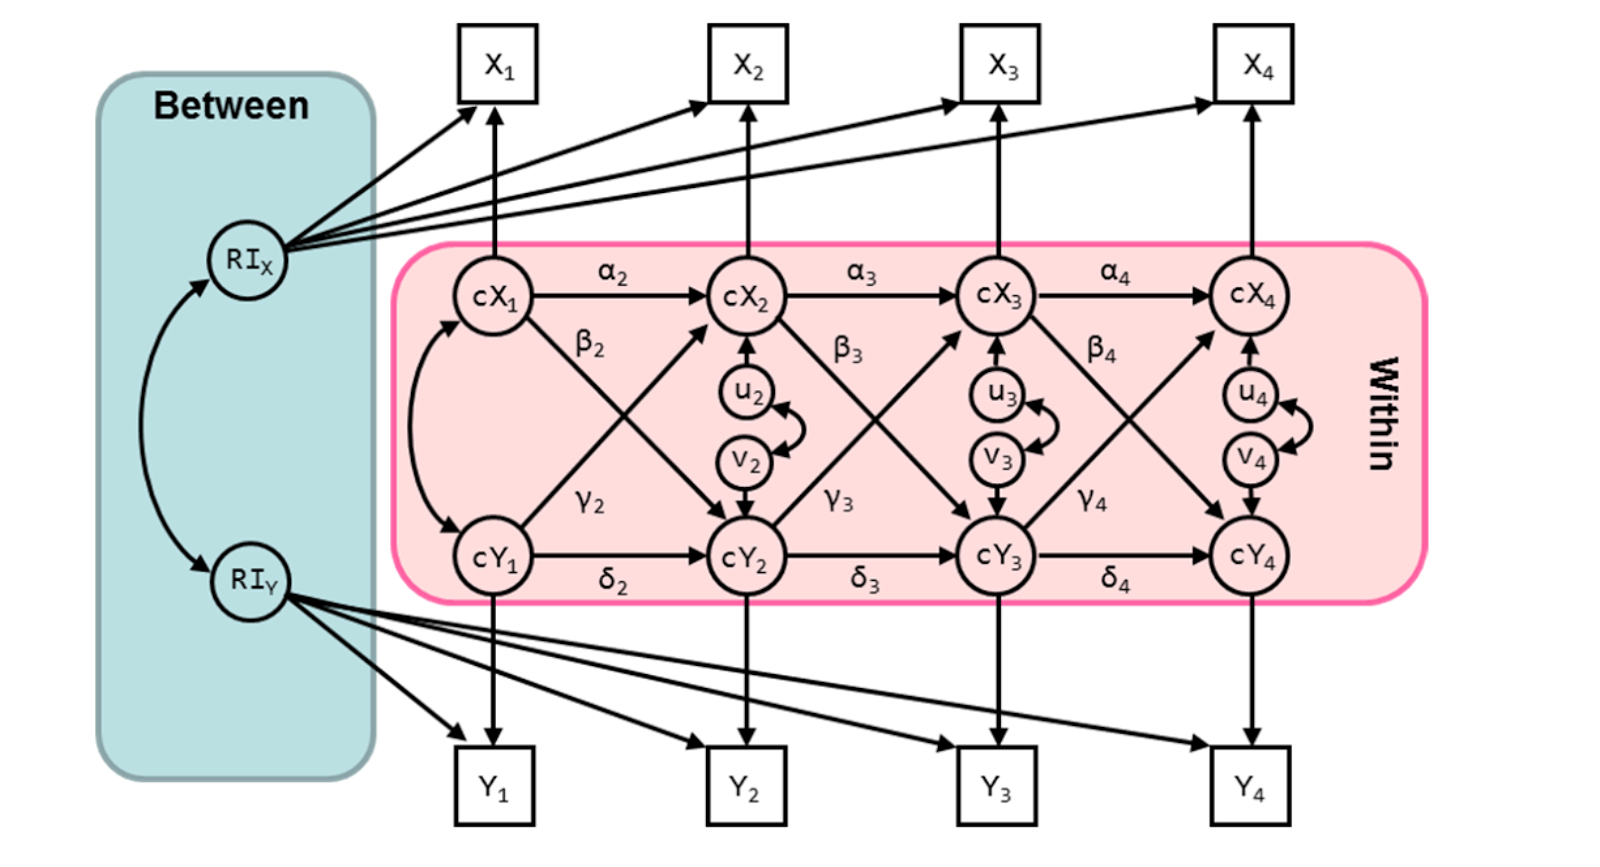
In the RI-CLPM we model the random intercept that captures the stable individual differences over time that do not change. We also model the “within-person variance” which are the cX’s and cY’s. These are the residuals or uniquenesses leftover at each wave that represent deviations from the absolutely stable variance modeled by the intercept. And, like the CLPM, we also model those pesky cross-sectional correlations among the residuals of the residuals.  

In the current norm space of the longitudinal, observational world, the RI-CLPM appears to be the new CLPM. That is, if you want to show that two things are “dynamically related” we can just use RI-CLPM now and everything will be honky dory. What is most fascinating is that you can write the same paper we used to write using the CLPM 15 years ago but with the RI-CLPM. That is, we can pose vague questions such as ‘are these two things “reciprocally related” over time?’ Typically, questions like these are posed about two things that just happen to be highly correlated in the cross-sectional space, like self-esteem and loneliness, or life satisfaction and depression. And, once modeled in the RI-CLPM, you can wander into the lexical thicket of causal terms like “reciprocal” or “effect”, which imply causal relations.  Before you go there, I have some questions that I’d love to know the answer to:

Do you really think you have satisfied the conditions for causality?

One of the primary implied assumptions of these types of models is a causal one. In my favorite gross oversimplification, causal inference can be justified if you have 1) a relation between two variables (association, otherwise known as correlation), 2) temporal precedence (the lag thingy), and 3) nonspuriousness–no other third variable might explain the results. Cross-lag models are Alice in Wonderland models. Every variable is a potential winner and all variables are candidates for causality largely because they formally satisfy two conditions of causality–association and temporal precedence. Unfortunately, longitudinal models in general, and cross-lagged models in particular, do little to address the third leg of causal inference–nonspuriousness–because they fail to control for third variable problems. 

Yes, even the RI-CLPM or ALT-SR, with their “within-person” estimates fail this test. There could easily be a third variable that is also changing in concert with things like self-esteem and loneliness that is responsible for the covariance of the residuals in these models. I can think of several third variable candidates for these variables like self-esteem and loneliness, such as finding a new best friend or changes in physical health. The joys of establishing a close relationship would sensibly lead to increases in self-esteem and decreases in loneliness. Decreasing health would make you feel less energy, probably lower self-esteem and increase loneliness. There are many others if you spend a little time thinking about them. Most problematically, without knowing how these third variables affect the covariance structure of our variables of interest the cross lags can’t be used to draw firm causal inferences. Nonetheless, we do.

What are you waiting for?

From my vantage point, the strength of the CLPM and RI-CLPM–the cross-lags–are also their weakness. The cross-lags indicate that the outcome is sometime down the road. Typically in developmental research a year or two or more down the road. This raises the question: What are you waiting for? In both cases the causal thing is measured/estimated at Time N-1 and used to predict an outcome at Time N. For example, I’m going to use self-esteem at age 24 to predict loneliness at age 25 controlling for loneliness at age 24 in the CLPM. In the RI-CLPM I’m going to predict a deviation in loneliness from the intercept at age 25 with a deviation from the self-esteem intercept at age 24.

Why would we do such a thing? You never see people asking a simple question. Why would it take a year or two or three for my time N-1 self-esteem to cause change in loneliness? Why wait? What theory dictates that changes in the way back would hang around and suddenly cause changes at some yet-to-be-determined time window in the future? Wouldn’t you assume that it would lead to change relatively soon after you measured/estimated it? More importantly, what theory has informed this decision? Find me a theory that says the best way to test the idea that self-esteem causes loneliness or change in loneliness is to wait a year before measuring it. Please. There are very few theoretical models that make this prediction and I would generalize a bit and say that I’ve never seen an argument made in any social/personality CLPM or RI-CLPM paper justifying the wait (Please show me one and I’ll happily amend this claim) 

And, to make things worse for all of you causal junkies, let’s say you do find a theory/rationalization/story that makes this prediction. Your new problem is that you’ve introduced one of the basic confounds of causality that you all learned in your first year of grad school when you read either Shadish and Cook or some variant–History. Once you open up that assessment time window you let in a litany of potential confounds that might be the real reason your outcome of interest has changed.  Good on ya.  Did you control for them in the model too?

Why aren’t you looking at contemporaneous change correlations?

This one is easy to answer. Because it’s a correlation, dummy. Very early in my disillusionment with the CLPM and other laggy models, I would point out to my collaborators that those contemporaneous correlations between the residuals were quite cool. After all, they represent the simultaneous correlation between change in one variable and change in another variable. Using our running example, my self-esteem change in 2025 is correlated with my loneliness change in 2025. By focusing on the contemporaneous change I’m linking change in one variable to change in another variable. In my opinion, these correlations are preferable to cross-sectional and cross-lagged correlations because they move one step closer to supporting causal investigations. After all, if change in self-esteem is correlated with change in loneliness in a naturalistic, observational setting this provides stronger support for doing an experiment later where you do a better job investigating whether changing self-esteem results in less loneliness. If contemporaneous change over time is uncorrelated, you have to ask why you would do the experiment at all.

What has the reaction been from my collaborators when I point out the potential importance of the contemporaneous correlations among the residuals? Typically stony silence if not outright hostility. Why? It’s a fucking correlation. And since the typical CLPM and RI-CLPM is applied to a multi-wave longitudinal study that can also fit growth models, you have another way of alienating your colleagues. Advise them to look at the correlation of the slopes of two latent change models instead of the cross-lags. Their looks of contempt will be indistinguishable from the one your daughter gives you when she finds the jar of your favorite condiment in the fridge has a best buy date from three years ago (now there’s a lag for you). Once we admit to examining cross-sectional correlations, we can’t feign causality, even though we shouldn’t be making causal inferences in the first place. No-one wants to look at correlations of anything because it gives up the myth of causality that we cloak ourselves with when we use longitudinal cross-lagged models of any sort.

Why are you assessing change without ever looking to see if it exists?

One of the facts that we like to keep to ourselves when wielding the CLPM or RI-CLPM is that they are attempts to capture change in something over time. When you predict the Time 2 variable while controlling for the Time 1 variable (CLPM) or predict the Time 3 residual while controlling for the intercept and Time 2 residual (RI-CLPM) you are studying change, at least in part. Underlying the focus on the cross-lagged effects is the assumption that change has occurred during those two waves of the study. This leads to a technical question. What is the base-rate of change in self-esteem or loneliness in any given wave-to-wave period of your study? It is possible, for example, that neither my self-esteem nor my loneliness changed in 2025. Shouldn’t the first question then be “Was there any change in my focal variables over the period of time I’ve studied them?  If there isn’t any change, then there would be no reason to test either the CLPM or the RI-CLPM.

This is a question that could be answered, but unfortunately is almost never entertained. There are technical and practical ways of answering this question (e.g., Roemer et al., 2025). You could use a wave-to-wave latent difference score model to determine whether there is any statistically significant variance in the change parameter. Alternatively, you could simply define what you believe to be meaningful change at the individual level wave-to-wave (one standard deviation? The Reliable Change Index?) and look to see how many of your participants experience those levels of change. If enough people exceed the “Smallest Effect Size of Interest” in this case, then on to the modeling we can go. If not, we have to question what the residual from each wave is measuring and whether it is reliable or valid.  But, instead of asking whether there is any change to study, the whole goal of the model, we typically go straight to running the model and greedily covet the happy p-values that we find even if it doesn’t make sense that they exist (see Lucas, 2025).

Let’s assume you’ve found some change that is to your liking, unfortunately, the questions continue…

Why are you satisfied with such shitty estimates of change?

The painfully awkward question is why would you use the least reliable approach to assessing change? In either the CLPM or RI-CLPM, you are using only two waves of data to make an estimate of change. It is functionally the same as taking a difference score (though not technically). Speaking of our friend, the difference score, what’s cool about difference scores is we understand the metric–you get more or less of something–and we can estimate the reliability. We know from too many criticisms of two-wave designs that difference scores are horribly unreliable (e.g., Cronbach & Furby, 1970). Why? You are using very little information to make an estimate and unreliability causes regression to the mean. It isn’t any different when you use wave-to-wave estimates from the CLPM or RI-CLPM. Reliability is not a function of the statistical model, it is a function of your design. Estimating change across two waves is analogous to using a single item measure instead of a multi-item measure. We all know that measuring our construct of interest we should measure it multiple times to get a reliable estimate. Change is no different. If you want a reliable signal, you need to assess people multiple times over time (Willett, 1989). Quant jocks have argued for decades that the worst way to estimate change is over just two waves (Cronbach & Furby, 1970). Yet, every cross-lag in the CLPM and RI-CLPM is exactly that–an estimate over two waves which is widely panned as the least optimal way of measuring change. 

What should we do?

We use cross-lagged models because they give off the sweet perfume of causality, where in reality they are laden with the stench of third variable confounds. Their cross-lagged structure is seldom informed by theory, they are used whether change occurs or not, and they do a piss poor job of assessing change even if it exists. 

What should we do instead?

First, we should stop using models just because they exist and can be applied to our data. The fact is, the CLPM and RI-CLPM are perfect matches for the typical longitudinal data structures we get from our in longitudinal designs–we follow people up, usually after a few years. If we have some more funds, we follow people up as many times as possible. These multi-wave designs are deceptively appealing because of their ability to interrogate temporal precedence. But as we’ve seen, this really doesn’t buy us much.  

My favorite alternative example is Rich Lucas’ research on life events and changes in subjective well-being (Lucas, 2007). He had the insight that these events, like death of a spouse, divorce, job loss, etc don’t happen that often in any given wave of data collected in a typical multi-wave longitudinal study. For example, if you stuck bereavement into a typical CLPM design (or god forbid in a time-varying covariate design), you would be hampered by the fact that so few people experience it at any given wave. So, even if we could test it, you wouldn’t find much because of the censoring of the data when so few people experience the event. Rich’s solution was to reorganize the longitudinal data around the life event rather than slavishly sticking with the arbitrary way in which the data were collected. Once you accrue a higher base rate by organizing the data around the event, you then have the ability to detect how it might relate to changes in well-being. 

Similarly, if you really are interested in whether change in self-esteem causes change in loneliness, you could re-organize the data around your a priori definition of meaningful change in self-esteem. Rather than sticking with the yearly assessments you could focus on when and if a preponderance of people increased in self-esteem and see if that is related to changes in loneliness.  Of course, you would have to define what a meaningful change in self-esteem might be….

Second, and similarly, if you are thinking about doing a longitudinal study and want to understand how things change, then make assessing change your priority. How do you measure change well? You measure your focal variables as often as you can over the time window that you are interested in or which is dictated by your theory so that you can get a reliable estimate of change over time (Singer & Willett, 2003). 

For example, if you really think that self-esteem changes reliably in a passive longitudinal study over a year, assess it enough times over a year to get a reliable estimate of change. The number of times you’ll need will be a function of how much it changes, how big your sample is, and the power needs you have in linking that change to other variables. It is not a simple equation. But we do know that assessing self-esteem two times is the least best way of doing things. An estimate of change based on 4 measurements of your variables is a better estimate of change than a wave-to-wave design, but it still may be inadequate. Maybe you’ll need 10. If so, do that. Then you can use tools like the Latent Growth Modeling to estimate change using the slope parameter.  And if you are still hooked on causality, you can use that slope to predict future changes in something else, hopefully while controlling for every third variable in existence.

The other thing we can do instead of running complex models on inadequate data is do an experiment. And I don’t mean the easy experiments we run on undergrads. I mean like the economists do–if the economists are interested in whether change in grit makes a difference, they design a high powered intervention, collect long-term outcome data that are preferably objective-ish (e.g., GPA; Alan et al, 2019). This might seem like crazy talk, but it’s not. The reality is if we want to really test whether self-esteem has a causal relation to loneliness, the ideal test to do is an experiment done at scale like the economists do. Yes, yes, I understand that this is unreasonable for the lone researcher at the typical psychology program in the US. But, it is the right design. I’d rather spend 5 years working in a collective to do the correct study than read the 20 vignette studies run on undergrads using self-reported outcomes that we would do in the meantime.  

So, next time you want to use the CLPM or RI-CLPM, do me a favor and try to answer these questions first. I really don’t care whether you are more interested in between or within variance. I care a lot more whether these models ask and answer any interesting questions and whether they do so well.  I don’t think they do.  Mostly what they do is impress people.  Last time I checked, that wasn’t the main goal of science.  Or is it?

References

Alan, S., Boneva, T., & Ertac, S. (2019). Ever failed, try again, succeed better: Results from a randomized educational intervention on grit. The Quarterly Journal of Economics, 134(3), 1121-1162.

Cronbach, L. J., & Furby, L. (1970). How we should measure” change”: Or should we?. Psychological bulletin, 74(1), 68.

Hamaker, E. L. (2023). The within-between dispute in cross-lagged panel research and how to move forward. Psychological Methods.

Lucas, R. E. (2007). Adaptation and the set-point model of subjective well-being: Does happiness change after major life events?. Current directions in psychological science, 16(2), 75-79.

Lucas, R. E. (2023). Why the cross-lagged panel model is almost never the right choice. Advances in Methods and Practices in Psychological Science, 6(1), 25152459231158378.

Lucas, R. E., Weidmann, R., & Brandt, M. J. (2025). Detecting spurious effects in cross-lagged panel models: Triangulation is not a valid test. European Journal of Personality, 39(5), 814-822.

Orth, U., Clark, D. A., Donnellan, M. B., & Robins, R. W. (2021). Testing prospective effects in longitudinal research: Comparing seven competing cross-lagged models. Journal of personality and social psychology, 120(4), 1013.

Rieger, S., Göllner, R., Trautwein, U., & Roberts, B. W. (2016). Low self-esteem prospectively predicts depression in the transition to young adulthood: A replication of Orth, Robins, and Roberts (2008). Journal of personality and social psychology, 110(1), e16.

Rogosa, D. (1980). A critique of cross-lagged correlation. Psychological bulletin, 88(2), 245.

Roemer, L., Lechner, C. M., Rammstedt, B., & Roberts, B. W. (2025). The base-rate and longer-term relevance of year-to-year change in personality traits. European Journal of Personality, 39(3), 257-275.

Schimmack, U. (2020). Why most cross-lagged models are false.  Replication Index. https://replicationindex.com/2020/08/22/cross-lagged/

Singer, J. D., & Willett, J. B. (2003). Applied longitudinal data analysis: Modeling change and event occurrence. Oxford university press.

Zahavi, A. (1975). Mate selection—a selection for a handicap. Journal of theoretical Biology, 53(1), 205-214.

* Some friends did give me editorial feedback. They are in no way responsible for the writing gaffs or problematic thinking. They did their best.

Posted in Uncategorized | Tagged | 2 Comments

Has conscientiousness really been in a free fall since 2014?*

Brent W. Roberts
A.J. Wright
Lena Roemer
Cavan Bonner

Recently Burn-Murdoch reported in the Financial Times (FT) that since 2014 conscientiousness was in a “free fall” in younger people, at least in the US. Conscientiousness is a major pillar of human functioning involving the capacity to control your impulses, keep things organized, follow through with promises, and to set and meet goals (Roberts et al., 2014). Why would we care if young people are decreasing in conscientiousness? For many good reasons. People who possess higher levels of conscientiousness tend to do better in school, go on to achieve higher levels of educational attainment, do better in the labor force, have more stable and rewarding relationships, better physical health, and not surprisingly also live longer (Spielmann et al., 2022). If young people are plummeting in conscientiousness, then their ability to thrive later in life may be undermined.  

These decreases, as pointed out by many colleagues, appear to contradict one of our most consistent findings in the field of personality development–the steady increase in levels of conscientiousness during young adulthood and into middle age (Bleidorn et al., 2022). Many people asked, what the heck is going on here? To that end, we’ve decided to write this missive to give people some perspective on the data reported in the FT article. We will attempt to address 6 questions: 1) Why are we particularly interested in this issue? 2) Was the estimate described in the FT article accurate? 3) How big or small was the change in conscientiousness? In other words, was it a “free fall?” 4) Have we seen similar things in past research? 5) Do we see similar patterns if we look at similar data? And, 6) what are some of the potential factors that might cause this type of change (age, period, cohort & screens…).  

Why are we interested in these issues?

​As developmental scientists, one of our obsessions is how personality changes with age. Do people get less neurotic?  Do they turn inwards and become more introverted with time? Is there change that might be described as maturity as people leave home and start their lives on their own? And, if you look at what we publish, you’ll be happy to see that we’ve published lots of research investigating how personality changes with age and why it might change the way it does. One of the realities of this research is that most of it is observational research–that is, we can’t control all the factors or run an experiment (until someone invents a time machine…). One of the burdens of observational research is that any observation may be confounded by multiple causes. In our case that means the age differences we see may not be attributable to age and the life experiences that come with the march of time. 

In particular, there are two alternative explanations that are commonly raised–cohort and period effects. If you have ever invoked the term “boomer” or “millennial” you know first hand what a cohort is–a group of people that are born at a specific time in history and because of that are exposed to a particular set of factors that make them different from other cohorts. Boomers are supposed to be goal-oriented and hard working. Millennials are purportedly team-oriented and socially conscious. Gen-Xers are supposed to be self-sufficient, largely because we abandoned them as children, etc. Purportedly, each cohort has a particular set of characteristics–at least, that’s what many consultants will tell you.** 

In contrast, period effects reflect the fact that everyone goes through an impactful historical experience that also leaves an indelible mark. As opposed to a cohort effect, a period effect applies to everyone and is not particular to one age group. Something like the Covid-19 pandemic, or the tragedy of 9-11 would qualify as period effects because they affected people of all ages.  

Unfortunately, studying age, period, and cohort effects is more than challenging. It means someone, somewhere had to administer the same measure to large groups of people of different ages over long periods of history. In our forthcoming paper, we found stashes of data in Germany and the US that did exactly that (Roemer et al., in press). The long story short of that work is that cohorts are a lot less important than we thought and period effects are more important than previously assumed. That is why we were immediately drawn to the FT article–it looks a lot like a period effect, which got us excited. Of course, the finding in the FT article was more broadly interesting because it seemingly contradicted the usual age finding that people inevitably march upwards in conscientiousness, especially young people. But, before we wrestle with the possibility that people no longer increase in conscientiousness with age, we need to look more closely at the data reported in the FT article, with our first question being whether the estimate provided was accurate.

Was the estimate provided in the FT article accurate?

The FT article relied on data from the Understanding America Study (UAS)*** which has been tracking many issues since 2014. The UAS is a longitudinal panel study that administers the questionnaires via the internet instead of paper and pencil or person-administered interview (e.g., the Health and Retirement Study). The data used in the FT article included an original cohort of participants who were repeatedly assessed since 2014 (and may have moved between age bins over time), as well as new participants who were brought in at later points in time to compensate for members of the original cohort leaving the study. How did these people change in conscientiousness over historical time?

The graph shows quite a dramatic decrease in conscientiousness, especially in the younger cohort, which the article author describes as a “free fall”. Needless to say, with those numbers and that figure it would be hard to disagree. Of course, that begs the question–what are those numbers? The author chose an unusual metric–each score after 2014 was plotted as the percentage of the score in 2014, which is an uncommon metric in the psychological literature, but purportedly more intuitively understandable to others. 

We are sympathetic to the challenge of how best to portray data so as to make it more understandable. We’ve faced that plight many times ourselves. We came to a different solution than the FT article. In particular, we often compute differences in standard deviation units, otherwise known as “d-scores”.  D-scores are the difference over time or different ages divided by an estimate of the scale standard deviation.****  Why do we like d-scores rather than what the FT author did? D-scores are convenient because they can be derived regardless of the measure and rating scale. Also, we have translated the differences we’ve seen in psychology across many different types of studies, which helps us to gain some perspective on the magnitude of the differences we see. For example, the average d-score effect size in psychology is .4 (Gignac & Szodorai, 2016).  So what do we see when we re-run these UAS changes in standard deviation units?  We see that the whole sample decreased in conscientiousness by a 5th of a standard deviation (d = -.23) over the past 10 years.  When we break the people out in the same age groups we see that older people changed very little (-.07), middle aged people decreased by .13 standard deviation units, and younger people decreased .50 standard deviation units. 

How big is that? Is it a free fall? To make that judgement, we need to compare these differences to other findings. For example, we know from hundreds of longitudinal studies that conscientiousness tends to increase from adolescence to old age about one total standard deviation. That comes to about a .25 of a standard deviation for each decade. Another metric can be seen in intervention studies, where it is common to find that many measures, but most importantly personality traits in particular, change about .3 standard deviation units, sometimes as much as .5 standard deviations (Roberts et al., 2017). To put things in perspective, we often say that seeing a therapist results in half a lifetime of personality change in just a few weeks. How then would we describe a .20 or a .50 standard deviation drop in conscientiousness? The .23 drop would be considered small. A .50 standard deviation drop, especially given the normative increase of about a .25 standard deviation increase during this time of life definitely deserves our attention. Is it a free fall? No. Is it a clear deviation from the norm? Definitely. 

Another reason we prefer something like a d-score instead of a percentage of a specific score at a specific time in a specific sample, is that we have accumulated a lot of information about d-scores. For example, in one of our studies, one standard deviation of conscientiousness predicted lasting one semester longer in college (Damian et al., 2015). As any parent of a U.S. college student can tell you, that’s worth a lot of money nowadays and may even be the difference between getting and not getting your degree. If young people are missing out on about .5 of a standard deviation of conscientiousness, that means half a semester of college, on average. That’s nothing to sneeze at. As we’ve seen elsewhere sometimes these little effects can happen at critical times in the life course putting people on less rewarding life paths (e.g., jail, worse jobs; Moffitt et al., 2011) and undermining people’s ability to “invest and accrue” the benefits of conscientiousness (Hill & Jackson, 2016). 

Have we seen this type of pattern before?

Many friends and colleagues were flummoxed by the UAS data because it appeared to contradict the increase in conscientiousness from adolescence to middle age that we have reported so often. Have we seen this type of data before?

In a word, yes. We have seen this type of data and it is not uncommon. 

First a comment about the general patterns of personality development that have been reported so widely. These patterns largely derive from meta-analyses. Meta-analyses naturally entail averaging many, many effects from many different studies. The observation that conscientiousness increases on average by about .25 standard deviations per decade therefore subsumes the fact that some studies found much larger increases while other studies found much smaller, if not negative changes. It is intrinsic to meta-analytic estimates, which are averages, that some studies buck the trend. So, by definition, we have seen these types of patterns in the past. All you have to do is look a little closer at the studies that go into those meta-analytic averages and by definition, you’ll see some studies that look like the UAS.

The figure below shows one of my favorite examples. It shows data from the GSOEP study (Lucas & Donnellan, 2011), which is a panel study conducted in Germany made up of a mix of younger and older people. So, you can simultaneously see age differences and longitudinal changes over time–much like the UAS study. In fact, the UAS data could have been depicted the same way and the picture would have been very similar. As you can see in the figure below from the paper, conscientiousness shows the reliable pattern of increases with age. In contrast, the changes over time are unusual. The younger people show increases over time, but the middle aged and older people show marked declines, even though they start out and remain higher than the young people. These decreases are not what we see in the averages. However, they are real and they do exist in these data. 

Imagine if a reporter in 2011 got a hold of these data with the similar motivations to write a click-worthy article about it. The title of that article would have been “Middle-aged Germans plummet in conscientiousness” or something to that effect. A missed opportunity? Maybe. Or, just an anomalous drift downward for some unknown reason that washes out over time and across generations.

From our perspective, then, it is important to keep in mind that the patterns of development are averages and that these averages can at times not be seen in some samples. Obviously, in the case of the UAS study, the trends for younger people definitely go against the average and beg the question of what is going on there and is this trend more widespread? It is more than possible that the general march upwards in conscientiousness has halted for the current generation. But, before we raise the alarms it is warranted to ask a simple question that we don’t ask often enough in psychology, does the pattern in the UAS study replicate?

Do we see similar patterns if we look at similar studies?

While the UAS is a highly valuable source of information, it is only one source. We live in the halcyon days for panel surveys and large data sets, both in the US and abroad. We used some of that data in our recent paper examining age, period, and cohort differences in personality and therefore have the luxury of seeing whether we see the same patterns in other people. One data set we examined were responses from millions of US citizens to a personality trait measure provided on https://www.outofservice.com/bigfive/. These data are not longitudinal nor is the sample meant to be representative, so it is not an exact replication of the UAS data, but nonetheless it is informative as it includes thousands of observations. If there is a general decline in conscientiousness, we should see similar patterns, should we not? In this case our data stretches back to 2000, not just 2014 so we have a longer view of the changes over time. As you can see below, among the young people, there was a slight decrease from 2014 to 2020, but now the decrease in standard deviation units is negligible compared to what we see in the UAS (d = -0.06)*****. Also, what we see when we go back beyond 2014 to 2000 is that 2014 appears to be a peak year. Young people might have decreased from 2014, but they appear to have simply returned to where they were in 2000. Hardly a free fall. It’s just the Gen Alphas falling into the outstretched arms of the Millennials.****** 

The next dataset is the National Longitudinal Study of Youth, which has been tracking young people for decades. In the figure below, you can see that starting in 2006, people in the NLSY actually increased from 2006 to 2012 (d = .14) where they bounced around and even increased (d = .16 total until 2016) after which they showed an ever so slight decline until 2020 and then a more pronounced drop in 2021. The difference between 2021 and 2006 is close to zero. 

Finally, we have the data from Germany from our forthcoming paper, a compilation of cross-sectional probability samples representative of the German population that were conducted over the past 20 years. Do they show the same plummet in conscientiousness from 2014 onward? In a word, no. They show a slight decline from 2014 to 2020.

In fact, it appears that Germans were most conscientious around 2006 rather than 2014 and if there was a decrease it started well before 2014. In fact, there is very little change whatsoever after 2014 (about 1/8th of a standard deviation). And, unlike the UAS sample, everyone in the German sample is decreasing from 2006 onwards.  

So, what does this mean for the findings reported in the FT article? The UAS pattern is clearly anomalous, unique to that sample of Americans in that particular study. Other studies show less of a decline, little or no change, or small increases. There is no general trend to decrease in conscientiousness after 2014, so trying to link the decrease in the UAS study to any specific historical cause would be more than premature. 

Welcome to the world of data, where our favorite findings crash upon the shoals of sampling variability. 

What are some of the potential factors that might cause this type of change?

It has been common for authors to invoke whatever malady seems to be the most popular as the source of issues in society, including the putative decrease in conscientiousness. At the moment, smartphones are having their 15 minutes of fame and the author of the FT article alludes to the possibility that they are the cause of the decrease in the UAS sample. This was a convenient if nonsensical leap. While this might be your favorite go to answer for all that ails the US population (thanks Jonathan!), it doesn’t appear to hold up when you start considering additional data. Europe adopted smartphones just like we did and they showed no conspicuous nor consistent decline in conscientiousness.

What are some of the other factors that might cause a downturn in conscientiousness?

  1. There is no there, there. It could just be random variation. No-one likes this possibility, but it is often the answer for why our studies fail to replicate.  
  2. It could be something specific about the people in that study or the experience of being in that study. UAS participants fill out numerous surveys per year for money. Maybe if you have the need for extra cash for years on end it is an indirect indicator that things are not working well for you?
  3. It could be something mundane, like where they put the personality measure in the survey. For example, one hypothesis for the declines shown above in Lucas and Donnellan (2011) concerned the fact that the personality measure was switched to later in the survey for the longitudinal follow up. By the time those older people got to the personality measure they were exhausted from plowing through so many questions and responded accordingly. 
  4. It could be the slightly different measures of conscientiousness used in each study.
  5. Or, maybe, just maybe it could be any number of other changes that have occurred over the last 10 to 20 years, like watching global warming cook our world ever so thoroughly, or the hollowing out the middle class in the US, or the decline in economic mobility, or the moral failings of leaders in all walks of life from clergy, to athletes, to politicians.  But we digress. It must be smartphones. 

We honestly don’t know why people might shift up and down over different periods of history.  We know they do but we really only have theories and working hypotheses as to why and we have a really tough time testing those theories because the data are hard to come by. 

In closing, we want to return to our work on age, period, and cohort to highlight one consistent finding most of the figures above, even in the UAS data. In every single sample we’ve examined, regardless of what is going on with period of history or with cohort, we see the same thing. Older people are more conscientious than younger people. We color coded all of the figures above just so you could see it clearly. The blue lines are always highest (older people), followed by the green lines (middle age), with the younger people (red lines) occupying the lower tier. So, if you were hoping that the inevitable march towards probity might have been curtailed by some social issue, you should be disappointed. The age effects look very, very robust. Period effects may push whole groups up or down a bit, but none of this moves the needle enough to contradict the argument that older people are more conscientious than younger people.  At least we have that going for us.

References

Bleidorn, W., Schwaba, T., Zheng, A., Hopwood, C. J., Sosa, S. S., Roberts, B. W., & Briley, D. A. (2022). Personality stability and change: A meta-analysis of longitudinal studies. Psychological Bulletin, 148(7-8), 588.

Damian, R. I., Su, R., Shanahan, M., Trautwein, U., & Roberts, B. W. (2015). Can personality traits and intelligence compensate for background disadvantage? Predicting status attainment in adulthood. Journal of personality and social psychology109(3), 473.

Gignac, G. E., & Szodorai, E. T. (2016). Effect size guidelines for individual differences researchers. Personality and individual differences, 102, 74-78.

Hill, P. L., & Jackson, J. J. (2016). The invest-and-accrue model of conscientiousness. Review of General Psychology, 20(2), 141-154.

Lucas, R. E., & Donnellan, M. B. (2011). Personality development across the life span: longitudinal analyses with a national sample from Germany. Journal of personality and social psychology, 101(4), 847.

Roberts, B. W., Lejuez, C., Krueger, R. F., Richards, J. M., & Hill, P. L. (2014). What is conscientiousness and how can it be assessed? Developmental Psychology, 50(5), 1315-1330.

Roberts, B.W., Luo, J., Briley, D.A., Chow, P., Su, R., & Hill, P.L.  (2017).  A systematic review of personality trait change through intervention.  Psychological Bulletin, 143, 117-141.

Roemer, L., Bonner, C. V., Rammstedt, B., Gosling, S. D., Potter, J., & Roberts, B. W. (2025). Beyond age and generations: How considering period effects reshapes our understanding of personality change. Journal of Personality and Social Psychology.

Spielmann, J., Yoon, H.J.R., Ayoub, M., Chen, Y., Eckland, N.S., Trautwein, U., Zhen, A., & Roberts, B.W. (2022). An in-depth review of conscientiousness and educational issues. Educational Psychology Review, 34(4), 2745-2781.

Footnotes

*Although Brent is taking full responsibility for this blog, A.J., Lena, and Cavan deserve disproportionate credit for putting the data together both for this and the relevant paper. That said, any misstatements, interpretive errors, or bad puns, are entirely Brent’s fault, as usual.

​**In reality, most cohort differences are just repackaged age differences.  Young people “these days” are a lot like young people “those days.”

***COI statement–Brent sits on the Data Monitoring Committee for the Understanding America Study. That means he periodically plays the role of Reviewer 2 for the authors of the study, blathering on about the dark arts of psychometrics and such. 

****For the measurement nerds, we always use the between-person metric so that the resulting effect sizes can be compared to the more common approach in psychology, which focuses on between-person differences.  The within-person metric can get wacky depending on how correlated things are over time.

​*****Another measurement nerdism:  We’ve scaled all of the y-axis’s in this blog so that they depict 1 standard deviation in the scale of interest.  That means the visual increases or decreases communicate change in standard deviation units. We like this approach because you can see the effect size on the d-metric, and it prevents us from doing Machiavellian things with the y-axis in order to make our effects look huge or small.

******The reason the lines for the older groups stop is that the number of people in those groups became too small for reliable estimates.

Posted in Uncategorized | Tagged , , , , , , | 2 Comments

Descriptive ulcerative counterintuitiveness

An interesting little discussion popped up in the wild and wooly new media world in science (e.g., podcasts and twitter) concerning the relative merits of “descriptive” vs “hypothesis” driven designs. All, mind you, indirectly caused by the paper that keeps on givingTal Yarkoni’s generalizability crisis paper.  

Inspired by Tal’s paper, a small group of folks endorsed the merits of descriptive work and the fact that psychology would do well to conduct more of this type of research (Two Psychologist, Four Beers; Very Bad Wizards). In response, Paul Bloom argued/opined for hypothesis testing–more specifically, theoretically informed hypothesis testing of a counterintuitive hypothesis.  

I was implicated in the discussion as someone who’s work exemplifies descriptive research. In fact, Tal Yarkoni himself has disparaged my work in just such a way.* And, I must confess, I’ve stated similar things in public, especially when I give my standard credibility crisis talk.  

So, it might come as a surprise to hear that I completely agree with Bloom that a surgical hypothesis test using experimental methods that arrives at what is described as a “counterintuitive” finding can be the bee’s knees. It is, and probably should be, the ultimate scientific achievement. If it is true, of course. 


That being said, I think there is some slippage in the verbiage being employed here.  There are deeper meanings lurking under the surface of the conversation like sharks waiting to upend the fragile scientific dingy we float in.  

First, let’s take on the term that Bloom uses, “counterintuitive,” which is laden with so much baggage it needs four porters to be brought to the room. It is both unnecessary and telling to use that exact phrase to describe the hypothetical ideal research paradigm. It is also, arguably, the reason why so many researchers are now clambering to the exits to get a breath of fresh, descriptive air.  

Why is it unnecessary? There is a much less laden term, “insight” that could be used instead.  Bloom partially justifies his argument for counterintuitive experiments with the classic discovery by Barry Marshall that ulcers are not caused by stress, as once was thought, but by a simple bacteria. Marshall famously gave himself an ulcer first, then successfully treated it with antibiotics. Bloom describes Marshall’s insight as counterintuitive. Was it? There was a fair amount of work by others pointing to the potential of antibiotics to treat peptic ulcers for several decades before Marshall’s work. An alternative take on the entire process of that discovery was that Barry Marshall had an insight that led to a “real” discovery that helped move the scientific edifice forward–as in, we acquired a better approximation of the truth and the truth works. As scientists, we all strive to have insights that move the dial closer to truth. Calling those insights counterintuitive is unnecessary. 

It is also telling that Bloom uses the term counterintuitive because it has serious sentimental value. It is a term that reflects the heady, Edge-heavy decades pre-Bem 2011 where we could publish counterintuitive after counterintuitive finding in Psychological Science using the Deathly Hallows of Psychological Science (because that was what that journal was for after all) that in retrospect were simply not true. Why were they not true? Because our experimental methods were so weak and our criteria for evaluating findings so flawed that our research got unmoored from reality. With a little due diligence–a few QRPs, a series of poorly powered studies, and some convenient rationalizations–(e.g., some of my grad students don’t have the knack to find evidence for what is clearly a correct hypothesis….), one could cook up all sorts of counterintuitive findings. There was so much counterintuitive that counterintuitive became counterintuitive.  And why did we do this? Because Bloom is right. The coolest findings in the history of science have that “aha” component demonstrated with a convincing experimental study.  

This is not to say that p-hacking and counterintuitive experimental methods are synonymous, just that as a field we valued counterintuitive findings so much that we employed problematic methods to arrive at them. Because of this unfortunate cocktail, the “counterintuitive” camp still has serious, painful reckoning to face. We got away with methodological malpractice for several decades in the service of finding counterintuitive results.  And, it was so cool. We were stars and pundits and public intellectuals riding a wave of confection that went poof. We ate ice cream for breakfast, lunch, and dinner. Even a small dose of methodological rigor dished up in the form of “eating your vegetables” is going to feel like punishment after that. But since the reproducibility rate of all of those counterintuitive findings is holding steady at less than 50%, I believe some vegetables are in order–or maybe an antibiotic. Having had an ulcer, I know first hand the robustness of Marshall’s work. The relief that occurred after the first dose of antibiotics was profound. Psychology does not currently produce robust findings like that. To opine for the old days when we could flog the data to produce counterintuitive results without first cleaning up our methods, while understandable, is also counterproductive.


Naturally, many folks have reacted to the credibility crisis, which the counterintuitive paradigm helped to foster, with something akin to revulsion and have gone in search of alternatives or fixes, some conceptual, some methodological. One consistent line of thinking is that we should prioritize a range of methods roughly described with terms like descriptive, observational, and exploratory. I’m going to go out on a slight nerdy, psychometrically-inspired interpretive limb here and say that these are all manifest indicators of the true latent factor behind these terms–reality-based research. A bunch of us would prefer that the work we do is grounded in reality–findings that are robust or, even more provocatively, findings that reflect the true nature of human nature.   

Chris Fraley put it to me well. He said that the call for more descriptive and exploratory research is grounded in the concern that we don’t have a sound foundation for understanding how and why people behave the way they do. The theory of evolution by natural selection, for example, would have not come about but for a huge repository of direct observations of animal behavior and morphology. Why not psychology? It seems reasonable that psychology should have a well-documented picture of the important dimensions of human thought, feeling, and behavior that is descriptively rich, grounded in the lives that people lead, accurate, and repeatable. When I hear colleagues say that we should do more descriptive work, this is what I’m hearing them say.

Preferably, this real understanding of human behavior would then be the basis upon which insightful experiments would be tested.


Of course, Bloom is partially right that descriptive work can and should put people to sleep. Much of my work does.**  Just ask my students. And just by being descriptive, it may not be any more useful than a counterproductive counterintuitively motivated experiment. What of all of that descriptive, observational work on ulcers before Barry Marshall’s work? It had come to the conclusion that stress caused ulcers. Would another observational study of stress and ulcer symptoms have brought insights to this situation? How about a fancy longitudinal, cross-lagged panel model? Ooooh, even better, a longitudinal, growth mixture model of stress and ulcer groups. I’m getting the vapors just thinking about it. No, sorry, given my experience with ulcers I prefer a keen insight into the mechanisms that allowed ulcers to be treated quickly and easily, thank you.  

That said, the fetishizing of clever counterintuitiveness and demeaning of descriptive work as boring also smacks of elitism. After all, the truth doesn’t care if it is boring. I remember watching in bemused wonderment back in grad school when Oliver John would receive ream after ream of factor structures in the snail mail from Lew Goldberg who was at the time cranking out the incredibly boring analyses that arrived at the insight that most of how we describe each other can be organized into five domains. It was like watching an accountant get really excited about a spreadsheet. On the other hand, the significance of the Big Five and the revolutionizing effect it has had on the field of personality psychology cannot be overstated. If there was an aha moment it wasn’t the result of anything counterintuitive. 

And the trope that observation and description of humans are intrinsically boring is possibly more of an indictment of psychologists’ lack of imagination and provincialism than anything else.  After all, there is an entire field across the quad from most of us called Anthropology that has been in the practice of describing numerous cultures, countries, and tribes across the globe. Human ethology, cultural anthropology, and behavioral ecology are remarkably interesting fields with often surprising insights into the uniquenesses and commonalities of all peoples. One could argue that we could get a head start on the whole description thing by reading some of their work instead of cooking up our own stew of descriptive research.

If there is a little homily to end this essay I guess it would be not to lionize either description or counterintuitive methods. Neither method has the market cornered on providing insight. 


* Just kidding. I think he meant it as a compliment.

** They say sleep is good for you. Therefore, my research can and does have a positive impact on society.

Posted in Uncategorized | Leave a comment

Robust Findings in Personality Psychology

Contributors to this blog (in alphabetical order a la the economists)

David Condon, Chris Fraley, Katie Corker, Rodica Damian, M Brent Donnelan, Grant Edmonds, David Funder, Don Lynam, Dan Mroczek, Uli Orth, Alexander Schackman, Uli Schimmack, Chris Soto, Brent Roberts, Jennifer Tackett; Brenton Wiernik, Sara Weston,


Scientific personality psychology has had a bit of a renaissance in the last few decades, emerging from a period of deep skepticism and subsequent self-reflection to a period  where we believe there are robust findings in our field.

The problem is that many people, and scientists, don’t follow scientific personality psychology and remain blithely unaware of the field’s accomplishments. In fact, it is quite common to do silly things like equate the field of scientific personality psychology with the commodity that is the MBTI.

With this situation in mind, I recently asked a subset of personality psychologists to help  identify what they believed to be robust findings in personality psychology.  You will find the product of that effort below.

We are not assuming that we’ve identified all of the robust findings.  In fact, we’d like you to vote on each one to see whether these are consensually defined “robust findings.”  Moreover, we’d love you to comment and suggest other candidates for consideration. All we ask is that you characterize the finding and suggest some research that backs up your suggestion.  We’ve kept things pretty loose to this point, but the items below can be characterized as findings that replicate across labs and have a critical mass of research that is typically summarized in one or more meta-analyses. We are open to suggestions about making the inclusion criteria more stringent.

Regardless of your feelings about this effort, I found the experience to be illuminating. At one level, I personally believe that every field should do this even if the result is not convincing. As people have noted, as self-described scientists we are in the enterprise of discovering reliable facts. If we can’t readily identify the provisional facts we’ve come up with and communicate them to others in simple language something is really, really wrong with our field.

If it is the case that you believe these findings are mundane or obvious, we look forward to the link to your post laying out what you thought was mundane and obvious from 2 years ago, or any time in the past for that matter. Lacking that, we suspect your contempt says more about you than about these findings.


Personality traits partially predict longevity at an equal level to, and above and beyond, socioeconomic status and intelligence.

Graham, E.K., Rutsohn, J.P., Turiano, N.A., Bendayan, R., Batterham, P., Gerstorf, D., Katz, M., Reynolds, C., Schoenhofen, E., Yoneda, T., Bastarache, E., Elleman, Zelinski, E.M., Johansson, B., Kuh, D., Barnes, L.L., Bennett, D., Deeg, D., Lipton, R., Pedersen, N., Piccinin, A., Spiro, A., Muniz-Terrera, G., Willis, S., Schaie, K.W., Roan, C., Herd, P., Hofer, S.M., & Mroczek, D.K. (2017). Personality predicts mortality risk: An integrative analysis of 15 international longitudinal studies.  Journal of Research in Personality, 70, 174-186.

Jokela, M., Airaksinen, J., Virtanen, M., Batty, G. D., Kivimäki, M., & Hakulinen, C. (2019). Personality, disability‐free life years, and life expectancy: Individual participant meta‐analysis of 131,195 individuals from 10 cohort studies. Journal of Personality.

Kern, M. L., & Friedman, H. S. (2008). Do conscientious individuals live longer? A quantitative review. Health psychology, 27(5), 505.

Roberts, B. W., Kuncel, N. R., Shiner, R., Caspi, A., & Goldberg, L. R. (2007). The power of personality: The comparative validity of personality traits, socioeconomic status, and cognitive ability for predicting important life outcomes. Perspectives on Psychological Science, 2(4), 313-345.


Personality traits partially predict career success above and beyond socioeconomic status and intelligence.

Damian, R. I., Su, R., Shanahan, M., Trautwein, U., & Roberts, B. W. (2015). Can personality traits and intelligence compensate for background disadvantage? Predicting status attainment in adulthood. Journal of Personality and Social Psychology, 109(3), 473.

Judge, T. A., Higgins, C. A., Thoresen, C. J., & Barrick, M. R. (1999). The Big Five Personality Traits, General Mental Ability, and Career Success Across the Life Span. Personnel Psychology, 52, 621-652.

Sutin, A. R., Costa Jr, P. T., Miech, R., & Eaton, W. W. (2009). Personality and career success: Concurrent and longitudinal relations. European Journal of Personality: 23(2), 71-84.

Trzesniewski, K. H., Donnellan, M. B., Moffitt, T. E., Robins, R. W., Poulton, R., & Caspi, A. (2006). Low self-esteem during adolescence predicts poor health, criminal behavior, and limited economic prospects during adulthood. Developmental Psychology, 42, 381-390. http://dx.doi.org/10.1037/0012-1649.42.2.381


Personality factors are partially heritable with most of the variance being from non-shared environmental influences and only a small portion being the result of shared environmental influences, like all other psychological constructs. 

Fearon, P., Shmueli‐Goetz, Y., Viding, E., Fonagy, P., & Plomin, R. (2014). Genetic and environmental influences on adolescent attachment. Journal of Child Psychology and Psychiatry, 55(9), 1033-1041.

Polderman, T. J., Benyamin, B., De Leeuw, C. A., Sullivan, P. F., Van Bochoven, A., Visscher, P. M., & Posthuma, D. (2015). Meta-analysis of the heritability of human traits based on fifty years of twin studies. Nature Genetics, 47(7), 702.

Tellegen, A., Lykken, D. T., Bouchard, T. J., Wilcox, K. J., Segal, N. L., & Rich, S. (1988). Personality similarity in twins reared apart and together. Journal of personality and social psychology, 54(6), 1031.

Vukasović, T., & Bratko, D. (2015). Heritability of personality: a meta-analysis of behavior genetic studies. Psychological Bulletin, 141(4), 769-785


Personality traits partially predict school grades. 

Noftle, E. E., & Robins, R. W. (2007). Personality predictors of academic outcomes: big five correlates of GPA and SAT scores. Journal of Personality and Social Psychology, 93(1), 116.

Poropat, A. E. (2009). A meta-analysis of the five-factor model of personality and academic performance. Psychological Bulletin, 135(2), 322-338.


Personality factors, including attachment, partially predict relationship satisfaction, but personality trait similarity does not.

Candel, O. S., & Turliuc, M. N. (2019). Insecure attachment and relationship satisfaction: A meta-analysis of actor and partner associations. Personality and Individual Differences, 147, 190-199.

Donnellan, M. B., Assad, K. K., Robins, R. W., & Conger, R. D. (2007). Do negative interactions mediate the effects of negative emotionality, communal positive emotionality, and constraint on relationship satisfaction? Journal of Social and Personal Relationships, 24, 557-573. http://dx.doi.org/10.1177/0265407507079249

Dyrenforth, P. S., Kashy, D. A., Donnellan, M. B., & Lucas, R. E. (2010). Predicting relationship and life satisfaction from personality in nationally representative samples from three countries: The relative importance of actor, partner, and similarity effects. Journal of Personality and Social Psychology, 99(4), 690-702.

Robins, R. W., Caspi, A., & Moffitt, T. E. (2002). It’s not just who you’re with, it’s who you are: Personality and relationship experiences across multiple relationships. Journal of personality, 70(6), 925-964.


The infamous personality coefficient compares favorably to other effect sizes studied in many areas of Psychology and related fields. Large effects are not expected when considering multiply-determined, consequential life outcomes. 

Ahadi, S., & Diener, E. (1989). Multiple determinants and effect size. Journal of Personality and Social Psychology, 56(3), 398-406.

Bosco, F. A., Aguinis, H., Singh, K., Field, J. G., & Pierce, C. A. (2015). Correlational effect size benchmarks. Journal of Applied Psychology, 100(2), 431-449.

Funder, D. C., & Ozer, D. J. (1983). Behavior as a function of the situation. Journal of Personality and Social Psychology, 44(1), 107-112.

Gignac, G. E., & Szodorai, E. T. (2016). Effect size guidelines for individual differences researchers. Personality and Individual Differences, 102, 74-78.

Hemphill, J. F. (2003). Interpreting the magnitudes of correlation coefficients. American Psychologist, 58, 78-79.

Hill, C. J., Bloom, H. S., Black, A. R., & Lipsey, M. W. (2008). Empirical benchmarks for interpreting effect sizes in research. Child Development Perspectives, 2(3), 172-177.

Paterson, T. A., Harms, P. D., Steel, P., & Credé, M. (2016). An assessment of the magnitude of effect sizes: Evidence from 30 years of meta-analysis in management. Journal of Leadership & Organizational Studies, 23(1), 66-81.

Richard, F. D., Bond Jr, C. F., & Stokes-Zoota, J. J. (2003). One hundred years of social psychology quantitatively described. Review of General Psychology, 7(4), 331-363.


Personality shows both consistency (rank relative to others) and change (level relative to younger self) across time. Personality continues to change across the lifespan (largest changes between ages 18 and 30, but continues later on) and the mechanisms of change include: social investment, life experiences, therapy, own volition

Bleidorn, W., Hopwood, C. J., & Lucas, R. E. (2018). Life events and personality trait change. Journal of Personality, 86(1), 83-96.

Bleidorn, W., Klimstra, T. A., Denissen, J. J., Rentfrow, P. J., Potter, J., & Gosling, S. D. (2013). Personality maturation around the world: A cross-cultural examination of social-investment theory. Psychological Science, 24(12), 2530-2540.

Damian, R. I., Spengler, M., Sutu, A., & Roberts, B. W. (2019). Sixteen going on sixty-six: A longitudinal study of personality stability and change across 50 years. Journal of Personality and Social Psychology, 117(3), 674.

Fraley, R. C., Vicary, A. M., Brumbaugh, C. C., & Roisman, G. I. (2011). Patterns of stability in adult attachment: An empirical test of two models of continuity and change. Journal of Personality and Social Psychology, 101, 974-992.

Hudson, N. W., Briley, D. A., Chopik, W. J., & Derringer, J. (2018). You have to follow through: Attaining behavioral change goals predicts volitional personality change. Journal of Personality and Social Psychology.

Mroczek, D.K., & Spiro, A, III. (2003).  Modeling intraindividual change in personality traits: Findings from the Normative Aging Study.  Journals of Gerontology: Psychological Sciences, 58B, 153-165. doi: 10.1093/geronb/58.3.P153

Roberts, B.W., & DelVecchio, W. F.  (2000). The rank-order consistency of personality from childhood to old age: A quantitative review of longitudinal studies.  Psychological Bulletin, 126, 3-25.

Roberts, B. W., Luo, J., Briley, D. A., Chow, P. I., Su, R., & Hill, P. L. (2017). A systematic review of personality trait change through intervention. Psychological Bulletin, 143(2), 117.

Roberts, B.W., Walton, K. & Viechtbauer, W.  (2006). Patterns of mean-level change in personality traits across the life course: A meta-analysis of longitudinal studies. Psychological Bulletin, 132, 1-25.

Milojev, P., & Sibley, C. G. (2017). Normative personality trait development in adulthood: A 6-year cohort-sequential growth model. Journal of Personality and Social Psychology, 112, 510-526. http://dx.doi.org/10.1037/pspp0000121

Srivastava, S., John, O. P., Gosling, S. D., & Potter, J. (2003). Development of personality in early and middle adulthood: Set like plaster or persistent change?. Journal of personality and social psychology, 84(5), 1041.

Terracciano, A., McCrae, R. R., Brant, L. J., & Costa, P. T. (2005). Hierarchical linear modeling analyses of the NEO-PI-R scales in the Baltimore Longitudinal Study of Aging. Psychology and Aging, 20, 493-506. http://dx.doi.org/10.1037/0882-7974.20.3.493


Personality-descriptive language, psychological tests, and pretty much every other form of describing or measuring individual differences in behavior can be organized in terms of five or six broad trait factors.

Ashton, M. C., Lee, K., & Goldberg, L. R. (2004). A hierarchical analysis of 1,710 English personality-descriptive adjectives. Journal of Personality and Social Psychology, 87(5), 707.

Goldberg, L. R. (1990). An alternative” description of personality”: The Big-Five factor structure. Journal of Personality and Social Psychology, 59(6), 1216.

McCrae, R. R., & Costa, P. T. (1987). Validation of the five-factor model of personality across instruments and observers. Journal of Personality and Social Psychology, 52(1), 81-90.

McCrae, R. R., & Costa, P. T. (1989). Reinterpreting the Myers-Briggs Type Indicator from the perspective of the five-factor model of personality. Journal of Personality, 57(1), 17-40.


Personality research replicates more reliably than many other areas of behavioral science.

Fraley, R. C., & Vazire, S. (2014). The N-pact factor: Evaluating the quality of empirical journals with respect to sample size and statistical power. PloS one, 9(10), e109019.

Soto, C. J. (2019). How replicable are links between personality traits and consequential life outcomes? The Life Outcomes of Personality Replication Project. Psychological Science, 30(5), 711-727.


Self-reports and informant-reports of personality agree with each other, but not perfectly. And both sources provide valid information.

Connolly, J. J., Kavanagh, E. J., & Viswesvaran, C. (2007). The convergent validity between self and observer ratings of personality: A meta‐analytic review. International Journal of Selection and Assessment, 15(1), 110-117.

Connelly, B. S., & Ones, D. S. (2010). An other perspective on personality: Meta-analytic integration of observers’ accuracy and predictive validity. Psychological Bulletin, 136(6), 1092-1122.

Orth, U. (2013). How large are actor and partner effects of personality on relationship satisfaction? The importance of controlling for shared method variance. Personality and Social Psychology Bulletin, 39, 1359-1372. http://dx.doi.org/10.1177/0146167213492429

Roisman, G.I., Holland, A., Fortuna, K., Fraley, R.C., Clausell, E., & Clarke, A. (2007). The Adult Attachment Interview and self-reports of attachment style: An empirical rapprochement. Journal of Personality and Social Psychology, 92, 678-697. 

Vazire, S. (2012). Who knows what about a person? The self-other knowledge asymmetry (SOKA) model. Journal of Personality and Social Psychology, 98(2), 281-300.


Behavioral “residue” of personality is everywhere.

Gladstone, J. J., Matz, S. C., & Lemaire, A. (2019). Can Psychological Traits Be Inferred From Spending? Evidence From Transaction Data. Psychological Science, 0956797619849435.

Gosling, S. D., Ko, S. J., Mannarelli, T., & Morris, M. E. (2002). A room with a cue: personality judgments based on offices and bedrooms. Journal of personality and social psychology, 82(3), 379.

Mehl, M. R., Gosling, S. D., & Pennebaker, J. W. (2006). Personality in its natural habitat: Manifestations and implicit folk theories of personality in daily life. Journal of Personality and Social Psychology, 90(5), 862-877.

Rentfrow, P. J., & Gosling, S. D. (2003). The do re mi’s of everyday life: the structure and personality correlates of music preferences. Journal of personality and social psychology, 84(6), 1236.

Vazire, S., & Gosling, S. D. (2004). e-Perceptions: Personality impressions based on personal websites. Journal of personality and social psychology, 87(1), 123.


Personality is at the core of mental health 

Crowe, M.L., Lynam, D.R., Campbell, W.K., & Miller, J.D. (2019). Exploring the structure of narcissism: Towards an integrated solution. Journal of Personality, 87, 1151-1169.

Hur, J., Stockbridge, M. D., Fox, A. S. & Shackman, A. J. (2019). Dispositional negativity, cognition, and anxiety disorders: An integrative translational neuroscience framework. Progress in Brain Research, 247, 375-436

Kotov, R., Gamez, W., Schmidt, F., & Watson, D. (2010). Linking “big” personality traits to anxiety, depressive, and substance use disorders: a meta-analysis. Psychological bulletin, 136(5), 768.

Lynam, D.R., & Miller, J.D. (2015). Psychopathy from a basic trait perspective: The utility of a five-factor model approach. Journal of Personality, 83, 611-626.

Lynam, D.R. & Widiger, T. (2001). Using the five factor model to represent the personality disorders: An expert consensus approach. Journal of Abnormal Psychology, 110, 401-412.

Miller, J.D., Lynam, D.R., Widiger, T., & Leukefeld, C. (2001). Personality disorders as extreme variants of common personality dimensions: Can the Five Factor Model adequately represent psychopathy? Journal of Personality, 69, 253-276.

Shackman, A. J., Tromp, D. P. M., Stockbridge, M. D., Kaplan, C. M., Tillman, R. M., & Fox, A. S. (2016). Dispositional negativity: An integrative psychological and neurobiological perspective. Psychological Bulletin, 142, 1275-1314.

Vize, C.E., Collison, K.L., Miller, J.D., & Lynam, D.R. (2019). Using Bayesian methods to update and expand the meta-analytic evidence of the Five-Factor Model’s relation to antisocial behavior. Clinical Psychology Review, 67, 61-77.

Widiger, T. A., Sellbom, M., Chmielewski, M., Clark, L. A., DeYoung, C. G., Kotov, R., … & Samuel, D. B. (2019). Personality in a hierarchical model of psychopathology. Clinical Psychological Science, 7(1), 77-92.

Wright, A. G., Hopwood, C. J., & Zanarini, M. C. (2015). Associations between changes in normal personality traits and borderline personality disorder symptoms over 16 years. Personality Disorders: Theory, Research, and Treatment, 6(1), 1.


Personality is partially predicts financial and economic outcomes, such as annual earnings, net worth and consumer spending

Denissen, J. J. A., Bleidorn, W., Hennecke, M., Luhmann, M., Orth, U., Specht, J., & Zimmermann, J. (2018). Uncovering the power of personality to shape income. Psychological Science, 29, 3-13. http://dx.doi.org/10.1177/0956797617724435

Judge, T. A., Livingston, B. A., & Hurst, C. (2012). Do nice guys—and gals—really finish last? The joint effects and agreeableness on income. Journal of Personality and Social Psychology, 102, 390-407. doi: 10.1037/a0026021

Moffitt, T. E., Arseneault, L., Belsky, D., Dickson, N., Hancox, R. J., Harrington, H., … & Sears, M. R. (2011). A gradient of childhood self-control predicts health, wealth, and public safety. Proceedings of the National Academy of Sciences, 108(7), 2693-2698.

Nyhus, E. K., & Pons, E. (2005). The effects of personality on earnings. Journal of Economic Psychology. 26(3), 363-384. 

Roberts, B., Jackson, J. J., Duckworth, A. L., & Von Culin, K. (2011, April). Personality measurement and assessment in large panel surveys. In Forum for health economics & policy (Vol. 14, No. 3). De Gruyter.

Weston, S. J., Gladstone, J. J., Graham, E. K., Mroczek, D. K., & Condon, D. M. (2019) Published advance access online September 13, 2018). Who Are the Scrooges? Personality Predictors of Holiday Spending. Social Psychological and Personality Science, 10, 775-782


Birth order is functionally unrelated to personality traits and only modestly related to cognitive ability.

Damian, R. I., & Roberts, B. W. (2015). The associations of birth order with personality and intelligence in a representative sample of US high school students. Journal of Research in Personality, 58, 96-105.

Rohrer, J. M., Egloff, B., & Schmukle, S. C. (2015). Examining the effects of birth order on personality. Proceedings of the National Academy of Sciences, 112(46), 14224-14229.

Rohrer, J. M., Egloff, B., & Schmukle, S. C. (2017). Probing birth-order effects on narrow traits using specification-curve analysis. Psychological Science, 28(12), 1821-1832.


Personality traits, especially conscientiousness and emotional stability, are partially related to reduced risk for Alzheimer’s disease syndrome.

Chapman, B. P., Huang, A., Peters, K., Horner, E., Manly, J., Bennett, D. A., & Lapham, S. (2019). Association Between High School Personality Phenotype and Dementia 54 Years Later in Results From a National US Sample. JAMA psychiatry

Terracciano, A., Sutin, A. R., An, Y., O’Brien, R. J., Ferrucci, L., Zonderman, A. B., & Resnick, S. M. (2014). Personality and risk of Alzheimer’s disease: new data and meta-analysis. Alzheimer’s & Dementia, 10(2), 179-186.

Wilson, R. S., Arnold, S. E., Schneider, J. A., Li, Y., & Bennett, D. A. (2007). Chronic distress, age-related neuropathology, and late-life dementia. Psychosomatic Medicine, 69(1), 47-53.

Wilson, R. S., Schneider, J. A., Arnold, S. E., Bienias, J. L., & Bennett, D. A. (2007). Conscientiousness and the incidence of Alzheimer disease and mild cognitive impairment. Archives of general psychiatry, 64(10), 1204-1212.


Personality traits partially predict job performance

Barrick, M. R., Mount, M. K., & Judge, T. A. (2001). Personality and performance at the beginning of the new millennium: What do we know and where do we go next? International Journal of Selection and Assessment, 9(1/2), 9–30. https://doi.org/10/frqhf2

Hurtz, G. M., & Donovan, J. J. (2000). Personality and job performance: The Big Five revisited. Journal of Applied Psychology, 85(6), 869–879. https://doi.org/10/bc7959

Oh, I.-S. (2009). The Five Factor Model of personality and job performance in East Asia: A cross-cultural validity generalization study (Doctoral dissertation, University of Iowa). Retrieved fromhttp://search.proquest.com/dissertations/docview/304903943/

van Aarde, N., Meiring, D., & Wiernik, B. M. (2017). The validity of the Big Five personality traits for job performance: Meta-analyses of South African studies. International Journal of Selection and Assessment, 25(3), 223–239. https://doi.org/10/cbhv

Particularly more motivation-driven behaviors (e.g., helping, rule breaking):

Berry, C. M., Carpenter, N. C., & Barratt, C. L. (2012). Do other-reports of counterproductive work behavior provide an incremental contribution over self-reports? A meta-analytic comparison. Journal of Applied Psychology, 97(3), 613–636. https://doi.org/10/fzktph

Berry, C. M., Ones, D. S., & Sackett, P. R. (2007). Interpersonal deviance, organizational deviance, and their common correlates: A review and meta-analysis. Journal of Applied Psychology, 92(2), 410–424. https://doi.org/10/b965s7

Chiaburu, D. S., Oh, I.-S., Berry, C. M., Li, N., & Gardner, R. G. (2011). The five-factor model of personality traits and organizational citizenship behaviors: A meta-analysis. Journal of Applied Psychology, 96(6), 1140–1166. https://doi.org/10/fnfd2q

And leadership:

Bono, J. E., & Judge, T. A. (2004). Personality and transformational and transactional leadership: A meta-analysis. Journal of Applied Psychology, 89(5), 901–910. https://doi.org/10/ctfhf9

Judge, T. A., Bono, J. E., Ilies, R., & Gerhardt, M. W. (2002). Personality and leadership: A qualitative and quantitative review. Journal of Applied Psychology, 87(4), 765–780. https://doi.org/10/bhfk7d

DeRue, D. S., Nahrgang, J. D., Wellman, N. E. D., & Humphrey, S. E. (2011). Trait and behavioral theories of leadership: An integration and meta-analytic test of their relative validity. Personnel Psychology, 64(1), 7–52. https://doi.org/10/fwzt2t

Among the Big Five, C has the largest and most consistent relationships:

Wilmot, M. P., & Ones, D. S. (2019). A century of research on conscientiousness at work. Proceedings of the National Academy of Sciences. https://doi.org/10/ggcjvr


There is a hierarchy of consistency in personality with cognitive abilities at the top followed by personality traits and then subjective evaluations like subjective well-being and life satisfaction

Conley, J. J. (1984). The hierarchy of consistency: A review and model of longitudinal findings on adult individual differences in intelligence, personality and self-opinion. Personality and Individual Differences, 5(1), 11-25.

Fujita, F., & Diener, E. (2005). Life satisfaction set point: stability and change. Journal of personality and social psychology88(1), 158.

Anusic, I., & Schimmack, U. (2016). Stability and change of personality traits, self-esteem, and well-being: Introducing the meta-analytic stability and change model of retest correlations. Journal of Personality and Social Psychology110(5), 766.


Posted in Uncategorized | 4 Comments

Lessons we’ve learned about writing the empirical journal article

How about a little blast from the past?  In rooting around in an old hard drive searching for Pat Hill’s original CV [1], I came across a document that we wrote way back in 2006 on how to write more effectively. It was a compilation of the collective wisdom at that time of Roberts, Fraley, and Diener. It was interesting to read after 13 years. Fraley and I have updated our opinions a bit. We both thought it would be good to share if only for the documentation of our pre-blogging, pre-twitter thought processes.

Manuscript Acronyms from Hell:  Lessons We’ve Learned on Writing the Empirical Research Article

 By Brent Roberts (with substantial help from Ed Diener and Chris Fraley)

Originally written sometime in 2006

Updated 2019 thoughts in blue

Here are a set of subtle lessons that we’ve culled from our experience writing journal articles.  They are intended as a short list of questions that you can ask yourself each time you complete an article.  For example, before you submit your paper to a journal, ask yourself whether you have created a clear need for the study in the introduction, or whether everything is parallel, etc.  This list is by no means complete, but we do hope that it is useful.

Create The Need (CTN). Have you created the need?  Have you made it clear to the reader why your study needs to be done and why he or she should care? This is typically done in one of two ways.  The first way is to show that previous research has failed to consider some connection or some methodological permutation or both. This means reviewing previous research in a positive way with a bite at the end in which you explain that, despite the excellent work, this research failed to consider several things. The second way is to point out that you are doing something completely unique. Even if you are taking this approach, you should review the “analogue” literature. The analogue literature is a line of research that is conceptually similar in content or method, but not exactly like your study.

Fraley 2019: I try to encourage my students to do this based on the ideas themselves. Specifically, the question should be so important, either for theoretical reasons or due to their natural appeal, that the “so what, who cares, why bother” (i.e., the “Caroline Trio”) is unambiguous.

I don’t like it when authors justify the need by saying something along the lines of “No one has addressed this yet.” Research doesn’t examine the association between coffee consumption and the use of two vs. one spaces after a period either. Thus, there is a gap in the literature. But the gap is appropriate: There is no need to address that specific question.

I mention this simply because, imo, the “need” should emerge not only from holes/limitations in the literature. The “need” should also be clear independently of what has or has not been done to date.

Always Be Parallel (APB). Every idea that is laid out in the introduction should be in the methods, results, and discussion. Moreover, the order of the ideas should be exactly the same in each section. Assume your reader is busy, tired, bored, or lazy, or some combination of these wonderful attributes. You don’t want to make your reader work too hard, otherwise they will quickly become someone who is not your reader. Parallelism also refers to emphasis. If you spend three pages discussing a topic in the introduction and two sentences in the results and discussion on the same topic, then you either have to 1) cut the introductory material, or 2) enhance the material in the results and discussion.

Correlate Ideas and Method (CIM). The methods that you choose to adopt in your study should be clearly linked to the concepts and ideas that inspire your research. Put another way, the method you are going to use (e.g., correlation, factor analysis, text analysis, path model, repeated measures experiment, between-subject experiment) should be clear to the readers before they get to the method section.

Eliminate All Tangents (EAT). If you introduce an idea that is not directly germane to your study, eliminate it. That is, if it is not part of your method or not tested in your results then eliminate it from your introduction. If it is important for future research, put it in your discussion.  Remember Bem’s maxim: If you find a tangent in your manuscript make it a footnote. In the next revision of the paper, eliminate all footnotes[2].

Roberts 2019: It is interesting looking back now and seeing that I cited without issue, Bem’s chapter that everyone now excoriates for containing a recipe for p-hacking. Yes, I used to assign that chapter to my students. In retrospect, and even now, his p-hacking section did not bother me, largely because I’ve always been a fan of exploratory and abductive approaches to research—explore first, then validate. If you are going to explore, then it is typically good to report what your data show you. Of course, you should not then “HARK the herald angels sing” and make up your hypotheses after that fact.

Always Be Deductive (ABD). Papers that start with a strong thesis/research question read better than papers that have an inductive structure. The latter build to the study through reviewing the literature. After several pages the idea for the study emerges. The deductive structure starts with the goal of the paper and then often provides an outline or advance organizing section at the beginning of the article informing the reader of what is to come.

Fraley 2019: I don’t endorse this claim strongly (but I think it has its uses). I think this mindset puts the author in the position of “selling” an idea–When authors use a deductive structure, I start to question their biases and whether they are more committed to the idea that motivates the deduction or the facts/data that could potentially challenge that framework.

No Ad Hominen Attacks (NAHA). Don’t point out the failings or foibles of researchers, even if they are idiots. This will needlessly piss of the researcher, who is most likely going to be a reviewer. Or, it will piss off friends of the researcher, who are also likely to be reviewers. If you are going to attack anything, then attack ideas[3].

Fraley 2019: Only an idiot would make this recommendation.

Roberts 2019: Have you considered being more active on Twitter?

Contrast Two Real Hypotheses (CTRH). Although not attainable in every instance, we like to design studies and write papers that contrast two theoretical perspectives or hypotheses in which one of the hypotheses is not the null hypothesis. This accomplishes several goals at once.  First, it helps to generate a deductive structure. Second, it tends to diminish the likelihood of ad hominin attacks, as you have to give both theoretical perspectives their due. In terms of analyses, it tends to force you into contrasting two models rather than throwing yourself against the shoals of the null hypothesis every time, which is relatively uninteresting.

Fraley 2019: This is the most important idea, in my mind. This is also a good place to call attention to Platt’s Strong Inference paper.

Writing Is Rewriting (WIR). There is no such thing as a “final” draft. There is simply the paper that you submit. This is not to say that you should be nihilistic about your writing and submit slipshod prose because there is no hope of attaining perfection. Rather, you should strive for perfection and learn to accept the fact that you will never achieve it.

Two-Heads-Are-Better-Than-One (THABTO). Have someone else read your paper before turning it in or submitting it. A second pair of eyes can detect flaws that you have simply habituated to after reading through the document for the 400th time. This subsumes the recommendation to always proofread your document. In general, we recommend collaborating with someone else. Often times, a second person possess skills that you lack. Working with that person leverages your combined skills. This inevitably leads to a better paper.

Grammarish rules:

Use Active Language (UAL). Where possible, eliminate the passive voice.

Define Your Terms (DYT). Make sure you define your concepts when they are introduced in the paper.

One Idea Per Sentence (OIPS).

Review Ideas Not People (RINP). When you have the choice of saying “Smith and Jones (1967) found that conscientiousness predicts smoking,” or “Conscientiousness is related to a higher likelihood of smoking (Smith & Jones, 1967),” choose the later.

Don’t Overuse Acronyms (DOA).

Ed Diener summarizes much of this more elegantly. When writing your paper make the introduction lead up to the questions you want to answer; don’t raise extra issues in the introduction that you don’t answer. Make it seem like what you are doing follows as the next direct and logical thing from what has already been done. Moreover, emphasize that what you are doing is not just a nice thing to do, but THE next thing that is essential to do.

Happy rewriting.

Fraley 2019: Another idea worth adding: Write in a way that would allow non-experts to understand what you’re doing and why. Also, many of your readers might not be Native-English speakers. As such, it is best to write directly and avoid turns of phrase or idioms. Focus on communicating ideas rather than showing off your vocabulary or your knowledge of obscure ideas.

Roberts 2019: I can’t help but think about this list of recommendations in light of the reproducibility crisis. The question I would ask now is whether these recommendations apply as well to a registered report as they would to the typical paper from 2006. I think the 2006 list implicitly accepted some of the norms of the time, especially that the null is never accepted, at least for publication, and HARKing was “good rhetoric.” Where the list might go astray now is not with registered reports, but in writing up exploratory research. I think we need some new acronyms and norms for exploratory studies. Of course, that would assume that the field actually decides to honor honestly depicted exploratory work, which it has yet to do. If we aren’t going to publish those types of papers, we don’t need norms do we?

Fraley 2019: Building off your latest comment, I don’t see anything in here that wouldn’t apply to registered reports or (explicitly) exploratory research. In each case, it is helpful to build a need for the work, to articulate alternative perspectives on what the answer might be (even if it is exploratory), to write clearly, eliminate tangents, not make personal attacks on other scholars, etc.

Having said that, I think most authors still operate under the assumption that, if they are testing a hypothesis (in a non-competing hypotheses scenario), they have to be “right” (“As predicted, …”) in order to get other people to value their contribution. I think we lack a framework for how to write about and discuss findings that are difficult to reconcile with existing models or which do not line up with expectations.

Do you have any 2019 recommendations on how to approach this issue?

My off-the-cuff initial suggestion is that we need to find a way, especially in our Discussion sections, to get comfortable with uncertainty. A study doesn’t need to provide “clean results” to make a contribution, and not every study needs to make a definitive contribution.

Roberts 2019. I think there are really deceptively simple ways to get comfortable with uncertainty. First, we could change the norms from valuing “The Show” which says publish clever, counterintuitive ideas that lead directly to the TED-Gladwellian Industrial Complex (e.g., a book contract and B-School job or funding from a morally questionable benefactor) to getting it right. And, by getting it right, I mean honestly portraying your attempts to test ideas and reporting on those attempts regardless of their “success.”  Good luck with that one.

A second deceptively simple way to grow comfortable with uncertainty is to work on important ideas that matter to people and society rather than what your advisor says is important. Who cares whether attachment is a type or continuum or whether the structure of conscientiousness includes traditionalism?  What matters is whether childhood attachment really has any consequential effects on outcomes we care about—likewise for conscientiousness. Instead of asking, “Does conscientiousness matter to _____”, we could ask “How do I help more adults avoid contracting Alzheimer’s disease.”  When asked that way, finding out what doesn’t work (e.g., a null effect) is just as important as finding out what does.

By the way, I just found a typo in the original text….13 years and countless readings by multiple people and it was still not “perfect.”


[1] Pat claims he only had 2 publications when he applied for our post doc.  I remember 7 to 9.  Needless to say, he went on to infamy by publishing at a rate during the post doc that no-one to my knowledge has matched.  I’d like to take credit for that but given the fact that he continues to publish at that rate, I’m beginning to think it was Pat….

[2] This, of course, is a bit of an overstatement.  As Chris Fraley points out, the judicious use of footnotes can assuage the concerns of reviewers that you failed to consider their research.  By eliminating tangents, I mean getting rid of entire paragraphs that are not directly relevant to your paper.

[3] This is not to say that the motivation for a line of research should not be inspired by a negative reaction to someone or someone’s ideas.  It is okay to get your underwear in a bunch over someone’s aggressive ignorance and then do something about it in your research.  Just don’t write it up that way.

Posted in Uncategorized | Leave a comment

It’s deja vu all over again

I seem to replicate the same conversation on Twitter every time a different sliver of the psychological guild confronts open science and reproducibility issues. Each conversation starts and ends the same way as conversations I’ve had or seen 8 years ago, 4 years ago, 2 years ago, last year, or last month.

In some ways that’s a good sign. Awareness of the issue of reproducibility and efforts to improve our science are reaching beyond the subfields that have been at the center of the discussion.  

Greater engagement with these issues is ideal. The problem is that each time a new group realizes that their own area is subject to criticism, they raise the same objections based on the same misconceptions, leading to the same mistaken attack on the messengers: They claim that scholars pursuing reproducibility or meta-science issues are a highly organized phalanx of intransigent, inflexible, authoritarians who are insensitive to important differences among subfields and who to impose a monolithic and arbitrary set of requirements to all research.  

In these “conversations,” scholars recommending changes to the way science is conducted have been unflatteringly described as sanctimonious, despotic, authoritarian, doctrinaire, and militant, and creatively labeled with names such as shameless little bullies, assholes, McCarthyites, second stringers, methodological terrorists, fascists, Nazis, Stasi, witch hunters, reproducibility bros, data parasites, destructo-critics, replication police, self-appointed data police, destructive iconoclasts, vigilantes, accuracy fetishists, and human scum. Yes, every one of those terms has been used in public discourse, typically by eminent (i.e., senior) psychologists.  

Villainizing those calling for methodological reform is ingenious, particularly if you have no compelling argument against the proposed changes*.  It is a surprisingly effective, if corrosive, strategy.  

Unfortunately, the net effect of all of the name calling is that people develop biased, stereotypical views of anyone affiliated with promoting open and reproducible science**. Then, each time a new group wrestles with reproducibility, we hear the same “well those reproducibility/open science people are militant” objection, as if it is at all relevant to whether you pre-register your study or not***.  And this is not to say that all who promote open and reproducible science are uniformly angelic. Far from it.  There are really nasty people who are also proponents of open science and reproducibility, and some of them are quite outspoken.  

Just. Like. Every. Other. Group. In. Psychology****.

And, just like every other group in psychology, the majority of those advocating for reform are modest and reasonable. But as seems to be the case in our social media world, the modest and reasonable ones are lost in the flurry of fury caused by the more noisy folk. More importantly, the existence of a handful of nasty people has no bearing on the value of the arguments themselves. Regardless of whether you hear it from a nasty person or a nice one, it would improve the quality of our scientific output if we aspired to more often pre-register, replicate, post our materials, and properly power our studies.

The other day on Twitter, I had the conversation again. My colleague Don Lynam (@drl54567) likened the sanctimonious of the reproducibility brigade to ex-smokers, which at first blush was a compelling analogy. Maybe we do get a bit zealous about reproducibility because we’ve committed ourselves to the task. Who hasn’t met a drug and alcohol counselor or ex-smoker who isn’t a tad bit too passionate about helping us to quit drinking and smoking?  

But, as I told Don, a better analogy is water sanitation.  

The job of a water sanitation engineer is to produce good, clean water. Some of us, circa 2011 or so*****, noticed a lot of E. coli in the scientific waters and concluded that our filtration system was broken. Some countered that a high amount of E. coli is normal in science and of no concern. Many of us disagreed. We pointed out how easily the filtration system could be improved to reduce the amount of E. coli–pre-registering our efforts, making our data and methods more open and transparent, directly replicating our own work, adequately powering our studies so that they actually can work as a filter–you get my point.

When you replace “scientific reform” with “water filtration” and “our subfield” with “our water source”, it reveals why having this same conversations over and over is so frustrating:


Them: “The water in our well is clean. There is no problem.”

Us: “Have you tested your water (e.g., registered replication report)?”

Them: “No.”

Us: “Then you can’t really be confident that your water is clean.”

Them: “Stop being so militant.”


Or,

Them: “I haven’t noticed any problems with our well, so there’s no reason to doubt the effectiveness of our filtration system.”

Us: “Has anyone else applied your filtration system to another well to make sure it works (direct replication)?”

Them: “No. Having other people do the same thing we do isn’t necessary (it’s a waste of time).”

Us: “But if you haven’t tested the effectiveness of your filtration system, how can you be sure that your filter works?”

Them: “Stop being so sanctimonious.”


Or,

Them: “Look at my shiny, innovative filtration system that I just created.”

Us: “Has it been tested in different wells (pre-registered study)?”

Them: “No. my job is to create new and shiny filters, not test whether they work for other people.”

Us: “But the water still has E. coli in it.”

Them: “Stop being such an asshole.”


Or,

Us: “Your well doesn’t give off enough water to even test (power your research better).”

Them: “What little water we have has always been perfectly clean”

Us: “How about if we dig your well deeper and bigger so we can get more water out of it to test?”

Them: “How dare you question the quality of my water you terrorist.”


Or,

Them: “We get pure, clean water from every well we dig”

Us: “Awesomesauce. Can you share your filtration system (open science)?”

Them: “With you? You’re not even an expert. You wouldn’t understand our system.”

Us: “If you post it in the town square we’ll try and figure it out with your help.”

Them: “Unqualified vigilante.”


Much of the frustration that I see on the part of those trying to clean the water, so to speak, is that the changes are benign and the arguments against the changes are weak, but people still attack the messenger rather than testing their water for E. coli. We have students getting sick (losing ground in graduate school) from drinking the polluted water (wasting time on bogus findings), and they blame themselves for drinking from non-potable water sources.

In the end, it would be lovely if everyone were kind and civil. It would be great if folks would stop using overwrought, historically problematic monikers for people they don’t like. But we know from experience that one person’s sober and objective criticism of a study is another person’s methodological terrorism. We know that being the target of replication efforts is intrinsically threatening. The emotions in science have been and will continue to run raw. When these conversations focus on the tone or the unsavory personal qualities of those suggesting change, it shows how powerfully people want to avoid cleaning up the water.

Of course, emotional reactions and name calling are immaterial to whether there is E. coli in the water. And, it is in every scientist’s long-term interest to fix our filtration system******. Because it is broken. Those promoting open science and the techniques of reproducibility are motivated to improve the drinking water of science. Tools, like pre-registration, posting materials, direct replication, increased power are not perfect and they merit ongoing discussion and improvement.  Yet presently, if you happen to be sitting on what you believe to be an unspoiled well-spring of scientific ideas, there is no better way to prove it than to have another team of scientists test your ideas in a well-powered, pre-registered, direct replication. When the results of that effort come in, we will be happy to discuss the findings, preferable in civil tones with no name calling.

Brent W. Roberts


*I’m not sure it was a deliberate decision, but if you want to avoid changing your methods, making the people the issue, not the ideas, is a brilliant strategy.

**In one very awkward, tragic dinner conversation one of my most lovely, kind colleagues described another one of my lovely, kind colleagues as a bully based solely on second hand rumors based on the name calling.

***A pre-registered hypothesis in need of testing–anyone who tells you the open science cabal is a cabal or militant or nasty or any other bad things, are scholars who have not attempted the reforms themselves and are looking for reasons not to change.

****And in science as a whole. And in life for that matter.

*****Some way before that.

******It might not be in every scientist’s short-term interest to do things well….


Posted in Uncategorized | 1 Comment

Yes or No 2.0: Are Likert scales always preferable to dichotomous rating scales?

A while back, Michael Kraus (MK), Michael Frank (MF) and me (Brent W Roberts, or BWR; M. Brent Donnellan–MBD–is on board for this discussion so we’ll have to keep our Michaels and Brents straight) got into a Twitter inspired conversation about the niceties of using polytomous rating scales vs yes/no rating scales for items.  You can read that exchange here.

The exchange was loads of fun and edifying for all parties.  An over-simplistic summary would be that, despite passionate statements made by psychometricians, there is no Yes or No answer to the apparent superiority of Likert-type scales for survey items.

We recently were reminded of our prior effort when a similar exchange on Twitter pretty much replicated our earlier conversation–I’m not sure whether it was a conceptual or direct replication….

In part of the exchange, Michael Frank (MF) mentioned that he had tried the 2-point option with items they commonly use and found the scale statistics to be so bad that they gave up on the effort and went back to a 5-point option. To which, I replied, pithily, that he was using the Likert scale and the systematic errors contained therein to bolster the scale reliability.  Joking aside, it reminded us that we had collected similar data that could be used to add more information to the discussion.

But, before we do the big reveal, let’s see what others think.  We polled the Twitterati about their perspective on the debate and here are the consensus opinions which correspond nicely to the Michaels’ position:

Most folks thought moving to a 2-point rating scale would decrease reliability.


Most folks thought it would not make a difference when examining gender differences on the Big Five, but clearly there was less consensus on this question.


And, most folks thought moving to a 2-point rating scale would decrease the validity of the scales.

Before I could dig into my data vault, M. Brent Donnellan (MBD) popped up on the twitter thread and forwarded amazingly ideal data for putting the scale option question to the test. He’d collected a lot of data varying the number of scale options from 7 points all the way down to 2 points using the BFI2.  He also asked a few questions that could be used as interesting criterion-related validity tests including gender, self-esteem, life satisfaction and age. The sample consisted of folks from a Qualtrics panel with approximately 215 people per group.

So, does moving to a dichotomous rating scale affect internal consistency?

Here are the average internal consistencies (i.e., coefficient alphas) for 2-point (Agree/Disagree), 3-point, 5-point, and 7-point scales: 


Just so you know, here are the plots for the same analysis from a forthcoming paper by Len Simms and company (Simms, Zelazny, Williams, & Bernstein, in press):

This one is oriented differently and has more response options, but pretty much tells the same story.  Agreeableness and Openness have the lowest reliabilities when using the 2-point option, but the remaining BFI domain scales are just fine–as in well above recommended thresholds for acceptable internal consistency that are typically found in textbooks.  


What’s going on here?

BWR: Well, agreeableness is one of the most skewed domains–everyone thinks they are nice (News flash: you’re not). It could be that finer grained response options allow people to respond in less extreme ways. Or, the Likert scales are “fixing” a problematic domain. Openness is classically the most heterogeneous domain that typically does not hold together as well as the other Big Five.  So, once again, the Likert scaling might be putting lipstick on a pig.

MK: Seeing this mostly through the lens of a scale user rather than a scale developer, I would not be worried if my reliability coefficients dipped to .70. When running descriptive stats on my data I wouldn’t even give that scale a second thought.  

Also I think we can refer to BWR as “Angry Brent” from this point forward?

BWR: I prefer mildly exasperated Brent (MEB).  And what are we to do with the Mikes? Refer to one of you as “Nice Mike” and the other as “Nicer Mike”?  Which one of you is nicer? It’s hard to tell from my angry vantage point.

MBD: I agree with BWR. I also think the alphas reported with 2-point options are still more or less acceptable for research purposes. The often cited rules of thumb about alpha get close to urban legends (Lance, Butts & Michaels 2006). Clark and Watson (1995) have a nice line in a paper (or at least I remember it fondly) about how the goal of scale construction is to maximize validity, not internal consistency. I also suspect that fewer scale points might prove useful when conducting research with non-college student samples (e.g. younger, less educated). And I like the simplicity of the 2-PL IRT model so the 2-point options hold some appeal. (The ideal point folks can spare me the hate mail). This might be controversial but I think it would be better (although probably not dramatically so) to use fewer response options and use the saved survey space/ink to increase the number of items even by just a few. Content validity will increase and the alpha coefficient will increase assuming that the additional items don’t reduce the average inter-item correlation.

BWR: BTW, we have indirect evidence for this thought–we ran an online experiment where people were randomly assigned to conditions to rate items using a 2-point scale vs a 5-point scale.  We lost about 300 people (out of 5000) in the 5-point condition due to people quitting before the end of the survey–they got tuckered out sooner when forced to think a bit more about the ratings.

MF: Since MK hasn’t chosen “nice Mike,” I’ll claim that label. I also agree that BWR lays out some good options for why the Likerts are performing somewhat better. But I think we might able to narrow things down more. In the initial post, I cited the conventional cognitive-psych wisdom that more options = more information. But the actual information gain depends on the way the options interact with the particular distribution of responses in the population. In IRT terms, harder questions are more informative if everyone in your sample has high ability, but that’s not true if ability varies more. I think the same thing is going on here for these scales – when attitudes vary more, the Likerts perform better (are more reliable, because they yield more information).

In the dataset above, I think that Agreeableness is likely to have very bunched up responses up at the top of the scale. Moving to the two-point scale then loses a bunch of information because everyone is choosing the same response. This is the same as putting a bunch of questions that are too easy on your test.

I went back and looked at the dataset that I was tweeting about, and found that exactly the same thing was happening. Our questions were about parenting attitudes, and they are all basically “gimmes” – everyone agrees with nearly all of them. (E.g., “It’s important for parents to provide a safe and loving environment for their child.”) The question is how they weight these. Our 7-point scale version pulls out some useful signal from these weightings (preprint here, whole-scale alpha was .90, subscales in the low .8s). But when we moved to a two-point scale, reliability plummeted to .20! The problem was that literally everyone agreed with everything.

I think our case is a very extreme example of a general pattern: when attitudes are very variant in a population, a 2-point scale is fine. When they are very homogeneous, you need more scale points.


What about validity?

Our first validity test is convergent validity–how well does the BFI2 correlate with the Mini-IPIP set of B5 scales?

BWR: From my vantage point we once again see the conspicuous nature of agreeableness.  Something about this domain does not work as well with the dichotomous rating. On the other hand, the remaining domains look like there is little or no issue with moving from a 7-point to a 2 point scale

MK: If all of you were speculating about why agreeableness doesn’t work as a two-point scale, I’d be interested in your thoughts. What dimensions of a scale might lead to this kind of reduced convergent validity? I can see how people would be unwilling to answer FALSE to statements like “I see myself as caring, compassionate” because, wow, harsh. Another domain might be social dominance orientation because most people have largely egalitarian views about themselves (possible willful ignorance), and so saying TRUE to something like “some groups of people are inherently inferior to other groups.” might be a big ask for the normal range of respondents.

BWR: I would assume that in highly evaluative domains you might run into distributional troubles with dichotomously rated items. With really skewed distributions you would get attenuated correlations among the items and lower reliability. On the other hand, you really want to know who those people are who say “no” to “I’m kind”.

MBD: I agree with BWR’s opening points. When I first read your original blog post, I was skeptical.  But then I dug around and found a recent MMPI paper (Finn, Ben Porath, & Tellegen, 2015) that was consistent with BWR’s points. I was more convinced but I still like seeing things for myself. Thus, I conducted a subject pool study when I was at TAMU and pre-registered my predictions. Sure enough, the convergent validity coefficients were not dramatically better for a 5-point response option versus T/F for the BFI2 items. I then collect additional data to push that idea but this is a consistent pattern I have seen with the BFI2 – more options aren’t dramatically better when it comes to response options. I have no clue if this extends beyond the MMPI/BFI/BFI-2 items or not. But my money is on these patterns generalizing.

As for Agreeableness, there is an interesting pattern that supports the idea that the items get more difficult to endorse/reject (depending on their polarity) when you constrain the response options to 2. If we convert all of the observed scores to the Percentage of Maximum Possible scores (see Cohen, Cohen, Aiken, & West, 1999), one could loosely compare across the formats. The average score for A in the 2-Point version was 82.78 (SD = 17.40) and it drops to 70.86 (SD = 14.26) in the 7 point condition. So this might be a case where giving more response options allows people to admit to less desirable characteristics (The results for the other composites were less dramatic). So, I think MK has a good point above that might qualify some of my enthusiasm for the 2-pt format for some kinds of content.  

MF: OK, so this discussion above totally lines up with my theory that agreeableness is less variable, especially the idea that range on some of these variables might be restricted due to social desirability. MBD, BWR, is this something that’s generally true that agreeableness has low variance? (A histogram of responses for each variable in the 7 point case would be useful to see this by eye).

More generally, just to restate the theory: 2-point is good when there is a lot of variance in the population. But when variance is compressed – whether due to social desirability or true homogeneity – more scale points are increasingly important.

BWR: I don’t see any evidence for variance issues, but I am aware of people reporting skewness problems with agreeableness.  Most of us believe we are nice. But, there are a few folks who are more than willing to admit to being not nice–thus, variances look good, but skewness may be the real culprit.


How about gender differences?


BWR: I see one thing in this table: sampling error.  There is no rhyme nor reason to the way these numbers bounce around to my read, but I’m willing to be convinced.

MBD: I should give credit to Les Morey (creator of the PAI) for suggesting this exploratory question. I am still puzzled why the effect sizes bounce around (and have seen this in another dataset). I think a deeper dive testing invariance would prove interesting. But who has the time?

At the very least, there does not seem to be a simple story here.  And it shows that we need a bigger N to get those CIs narrower. The size of those intervals make me kind of ill.

MF: I love that you guys are upset about CIs this wide. Have you ever read an experimental developmental psychology study? On another note, I do think it’s interesting that you’re seeing overall larger effects for the larger numbers of scale points. If you look at the mean effect, it’s .20 for the 7-pt, and .10 for the 2-pt, 15.5 for the 3-pt, and .2 for the 5-pt. So sure, lots of sampling error, but still some kind of consistency…

MK: Despite all the bouncing around, there doesn’t seem to be anything unusual about the two-option scale confidence intervals.

And now the validity coefficients for self-esteem (I took the liberty of reversing the N scores to ES scores so everything was positive).

BWR: On this one the True-False scales actually do better than the Likert scales in some cases.  No strong message here.

MK: This is shocking to me! Wow! One question though — could the two-point scale items just be reflecting this overall positivity bias and not the underlying trait construct. That is, if the two point scales were just measures of self-esteem would this look just like it does here? I guess I’m hoping for some discriminant validity… or maybe I’d just like to see how intercorrelated the true-false version is across the five factors and compare that correlation to the longer Likerts.

BWR: Excellent point MK. To address the overall positivity bias inherent in a bunch of evaluative scales, we correlated the different B5 scales with age down below. Check it out.

MK: That is so… nice of you! Thanks!

BWR: I wish you would stop being so nice.

MF: I agree that it’s a bit surprising to me that we see the flip, but, going with my theory above, I predict that extraversion is the scale with the most variance in the larger likert ratings. That’s why the 2-pt is performing so well – people really do vary in this characteristic dramatically AND there’s less social desirability coming out in the ratings, so 2-point is actually useful.


And finally the coefficients for life satisfaction

MK: I’m a believer now, thanks Brent and Angry Brent!

MBD: Wait, which Brent is Angry! 😉

MF: Ok, so if I squint I can still say some stuff about variance etc. But overall it is true that the validity for the 2-point scale is surprisingly reasonable, especially for these lower-correlation measures. In particular, maybe the only things that really matter for life-satisfaction correlations are the big differences; so you accentuate these characteristics in the 2-pt and get rid of minor variance due to other sources.


How about age?

As was noted above, self-esteem and life satisfaction are rather evaluative, as are the Big Five and that might create too much convergent validity and not enough discriminant validity. What about a non-evaluative outcome like age?  Each of the samples was on average in their 50s with age ranges from young adulthood through old age. So, while the sample sizes were a little small for stable estimates (we like 250 minimum), age is not a bad outcome to correlate to because it is clearly not biased from social desirability.  Unless, of course, we lie systematically about our age….

If you are keen on interpreting these coefficients, the confidence intervals for samples of this size are about + or – .13. Happy inferencing.

BWR: I find these results really interesting. Despite the apparent issues with the true-false version of agreeableness, it actually has the largest correlation with age–actually higher than most prior reports, which admittedly are based on 5-point rating scale measures of the Big Five. I’m tempted to interpret the 3-Point scales as problematic, but I’m going to go with sampling error again. It was probably just a funky sample.

MK: OK then. I agree, I think the 3-point option is being the strangest for agreeableness.

MBD: I have a second replication sample where I used 2,3,4,5,6, and 7 response formats.  The cell sizes are a bit smaller but I will look at those correlations in that one as well.


General Thoughts?

MBD: This was super fun and appreciate that you three let me join the discussion. I admit that when I originally read the first exchange, I thought something was off about BWR’s thinking [BWR–you are not alone in that thought]. I was in a state of cognitive dissonance as it went against a ”5 to 7 scale points are better than alternatives” heuristic. Reading the MMPI paper was the next step toward disabusing myself of my bias. Now after collecting these data, hearing a talk by Len Simms about his paper, and so forth, I am not as opposed to using fewer scale points than I was in the past. This is especially true if it allows one to collect additional items. That said, I think more work about content by scale point interactions is needed for the reasons brought up in this post. However, I am a lot more positive to 2-point scales than I was in the past.  Thanks!

MF: Agreed – this was an impressive demonstration of Angry Brent’s ideas. Even though 7-pt sometimes is still performing better, overall the lack of problems with 2-pt is really food for thought. Even I have to admit that sometimes the 2-pt can be simpler and easier. On the other hand, I will still point to our parenting questionnaire – which is much more tentative and early stage in terms of the constructs it measures than the B5! In that case, it essentially destroyed the instrument to use a 2-pt scale because there was so much consensus (or social desirability)! So while I agree with the theoretical point from the previous post – consider 2-pt scales! – I also want to sound a cautious note here because not every domain is as well-understood.

MK: Agree on the caution that MF alludes but wow, the 2-point scale performed far better than I anticipated. Thanks for doing this all!

BWR: I love data. It never conforms perfectly to your expectations. And, as usual, it raises as many questions as it answers. For me, the overriding question that emerges from these data is whether 2-point scales are problematic with less coherent and skewed domains or whether 2-point scales are excellent indicators that you have a potentially problematic set of items that you are papering over by using a 5-point scale?  It may be that the 2-point scale approach is like the canary in the measurement coal mine–it will alert us to problems with our measures that need tending to.

These data also teach the lesson Clark and Watson (1995) provide that validity should be paramount. My sense is that those of us in the psychometric trenches can get rather opinionated about measurement issues, (Use omega rather than Cronbach’s alpha; use IRT rather than classical test theory, etc.) that translate into nothing of significance when you condition your thinking on validity.  Our reality may be that when we ask questions, people are capable of telling us a crude “yeah, that’s like me” or “no, not really like me” and that’s about the best we can do regardless of how fine grained our apparent measurement scales are.

MBD: Here’s a relevant quote from Dan Ozer: “It seems that it is relatively easy to develop a measure of personality of middling quality (Ashton & Goldberg, 1973), and then it is terribly difficult to improve it.” (p. 685).

Thanks MK, MF, and MBD for the nerdfest.  As usual, it was fun.


References


Clark, L. A., & Watson, D. (1995). Constructing validity: Basic issues in objective scale development. Psychological assessment, 7(3), 309.

Cohen, P., Cohen, J., Aiken, L. S., & West, S. G. (1999). The problem of units and the circumstance for POMP. Multivariate behavioral research, 34(3), 315-346.

Finn, J. A., Ben-Porath, Y. S., & Tellegen, A. (2015). Dichotomous versus polytomous response options in psychopathology assessment: Method or meaningful variance?. Psychological assessment, 27(1), 184.

Lance, C. E., Butts, M. M., & Michels, L. C. (2006). The sources of four commonly reported cutoff criteria: What did they really say?. Organizational research methods, 9(2), 202-220.

Simms, L.J., Zelazny, K., Williams, T.F., & Bernstein, L. (in press).  Does the number of response options matter? Psychometric perspectives using personality questionnaire data.  Psychological Assessment.

P.S. George Richardson pointed out that we did not compare even numbered response options (e.g., 4-point) vs odd numbered response options (e.g., 5-point) and therefore do not confront the timeless debate of “should I include a middle option.”  First, Len Simms paper does exactly that–it is a great paper and shows that it makes very little difference. Second, we did a deep dive into that issue for a project funded by the OECD. Like the story above, it made no difference for Big Five reliability or validity if you used 4 or 5 point scales. If you used an IRT model (ggum) in some cases you got a little more information out of the middle option that was of value (e.g., neuroticism). It never did psychometric damage to have a middle option as many fear. So, you may want to lay to rest the argument that everyone will bunch to the middle when you include a middle option.

Posted in Uncategorized | 4 Comments

Eyes wide shut or eyes wide open?

There have been a slew of systematic replication efforts and meta-analyses with rather provocative findings of late. The ego depletion saga is one of those stories. It is an important story because it demonstrates the clarity that comes with focusing on effect sizes rather than statistical significance.

I should confess that I’ve always liked the idea of ego depletion and even tried my hand at running a few ego depletion experiments.* And, I study conscientiousness which is pretty much the same thing as self-control—at least as it is assessed using the Tangney et al self-control scale (2004) which was meant, in part, to be an individual difference complement to the ego depletion experimental paradigms.

So, I was more than a disinterested observer as the “effect size drama” surrounding ego depletion played out over the last few years. First, you had the seemingly straightforward meta analysis by Hagger et al (2010), showing that the average effect size of the sequential task paradigm of ego-depletion studies was a d of .62. Impressively large by most metrics that we use to judge effect sizes. That’s the same as a correlation of .3 according to the magical effect size converters. Despite prior mischaracterizations of correlations of that magnitude being small**, that’s nothing to cough at.

Quickly on the heels of that meta-analysis were new meta-analyses and re-analyses of the meta-analytic data (e.g., Carter et al, 2015). These new meta-analyses and re-analyses concluded that there wasn’t any “there” there. Right after the Hagger et al paper was published, the quant jocks came up with a slew of new ways of estimating bias in meta-analyses. What happens when you apply these bias estimators to ego depletion data? There seemed to be a lot of bias in the research synthesized in these meta-analyses. So much so that the bias-corrected estimates included a zero effect size as a possibility (Carter et al., 2015). These re-analyses were then re-analyzed because the field of bias correction was moving faster than basic science and these initial corrections were called into question because apparently bias corrections are, well, biased… (Friese et al., 2018).

Not to be undone by an inability to estimate truth from the prior publication record, another, overlapping group of researchers conducted their own registered replication report—the most defensible and unbiased method of estimating an effect size (Hagger et al., 2016). Much to everyone’s surprise, the effect across 23 labs was something close to zero (d = .04). Once again, this effort was criticized for being a non-optimal test of the ego depletion effect (Friese et al., 2018).

To address the prior limitations of all of these incredibly thorough analyses of ego depletion, yet a third team took it upon themselves to run a pre-registered replication project testing two additional approaches to ego-depletion using optimal designs (Vohs, Schmeichel & others, 2018). Like a broken record, the estimate across 40 labs resulted in effect size estimates that ranged from 0 (if you assumed zero was the prior) to about a d of .08 if you assumed otherwise***. If you bothered to compile the data across the labs and run a traditional frequentist analysis, this effect size, despite being minuscule was statistically significant (trumpets sound in the distance).

So, it appears the best estimate of the effect of ego depletion is around a d of .08, if we are being generous.

Eyes wide shut

So, there were a fair number of folks who expressed some curiosity about the meaning of the results. They asked questions on social media, like, “The effect was statistically significant, right? That means there’s evidence for ego depletion.”

Setting aside effect sizes for a moment, there are many reasons to see the data as being consistent with the theory. Many of us were rooting for ego depletion theory. Countless researchers were invested in the idea either directly or indirectly. Many wanted a pillar of their theoretical and empirical foundational knowledge to hold up, even if the aggregate effect was more modest than originally depicted. For those individuals, a statistically significant finding seems like good news, even if it is really cold comfort.

Another reason for the prioritization of significant findings over the magnitude of the effect is, well, ignorance of effect sizes and their meaning. It was not too long ago that we tried in vain to convince colleagues that a Neyman-Pearson system was useful (balance power, alpha, effect size, and N). A number of my esteemed colleagues pushed back on the notion that they should pay heed to effect sizes. They argued that, as experimental theoreticians, their work was, at best, testing directional hypotheses of no practical import. Since effect sizes were for “applied” psychologists (read: lower status), the theoretical experimentalist had no need to sully themselves with the tools of applied researchers. They also argued that their work was “proof of concept” and the designs were not intended to reflect real world settings (see ego depletion) and therefore the effect sizes were uninterpretable. Setting aside the unnerving circularity of this thinking****, what it implies is that many people have not been trained on, or forced to think much about, effect sizes. Yes, they’ve often been forced to report them, but not to really think about them. I’ll go out on a limb and propose that the majority of our peers in the social sciences think about and make inferences based solely on p-values and some implicit attributes of the study design (e.g., experiment vs observational study).

The reality, of course, is that every study of every stripe comes with an effect size, whether or not it is explicitly presented or interpreted. More importantly, a body of research in which the same study or paradigm is systematically investigated, like has been done with ego depletion, provides an excellent estimate of the true effect size for that paradigm. The reality of a true effect size in the range of d = .04 to d = .08 is a harsh reality, but one that brings great clarity.

Eyes wide open

So, let’s make an assumption. The evidence is pretty good that the effect size of sequential ego depletion tasks is, at best, d = .08.

With that assumption, the inevitable conclusion is that the traditional study of ego depletion using experimental approaches is dead in the water.

Why?

First, because studying a phenomenon with a true effect size of d = .08 is beyond the resources of almost all labs in psychology. To have 80% power to detect an effect size of d = .08 you would need to run more than 2500 participants through your lab. If you go with the d = .04 estimate, you’d need more than 9000 participants. More poignantly, none of the original studies used to support the existence of ego depletion were designed to detect the true effect size.

These types of sample size demands violate most of our norms in psychological science. The average sample size in prior experimental ego depletion research appears to be about 50 to 60. With that kind of sample size, you have 6% power to detect the true effect.

What about our new rules of thumb, like do your best to reach an N of 50 per cell, or use 2.5 the N of the original study, or crank the N up above 500 to test an interaction effect? Power is 8%, 11%, and 25% in each of those situations, respectively. If you ran your studies using these rules of thumb, you would be all thumbs.

But, you say, I can get 2500 participants on mTurk. That’s not a bad option. But, you have to ask yourself: To what end? The import of ego depletion research and much experimental work like it, is predicated on the notion that the situation is “powerful,” as in, it has a large effect. How important is ego depletion to our understanding of human nature if the effect is minuscule? Before you embark on the mega study of thousands of mTurkers, it might be prudent to answer this question.

But, you say, some have argued that small effects can cumulate and therefore be meaningful if studied with enough fidelity and across time. Great. Now all you need to do is run a massive longitudinal intervention study where you test how the minuscule effect of the manipulation cumulates over time and place. The power issue doesn’t disappear with this potential insight. You still have to deal with the true effect size of the manipulation being a d of .08. So, one option is to use a massive study. Good luck funding that study. The only way you could get the money necessary to conduct it would be to promise doing an fMRI of every participant. Wait. Oh, never mind.

The other option would be to do something radical like create a continuous intervention that builds on itself over time—something currently not part of ego depletion theory or traditional experimental approaches in psychology.

But, you say, there are hundreds of studies that have been published on ego depletion. Exactly. Hundreds of studies have been published that had average d-value of .62. Hundreds of studies have been published showing effect sizes that cannot, by definition, be true given the true effect size is d = .08. That is the clarity that comes with the use of accurate effect sizes. It is incredibly difficult to get d-values of .62 when the true d is .08. Look at the distribution of d-values around zero with sample sizes of 50. The likelihood of landing a d of .62 or higher is about 3%. This fact invites some uncomfortable questions. How did all of these people find this many large effects? If we assume they found these relatively huge, highly unlikely effects by chance alone, this would mean that there are thousands of studies lying about in file drawers somewhere. Or it means people used other means to dig these effects out of the data….

Setting aside the motivations, strategies, and incentives that would net this many findings that are significantly unlikely to be correct (p < .03), the import of this discrepancy is huge. The fact that hundreds of studies with such unlikely results were published using the standard paradigms should be troubling to the scientific community. It shows that psychologists, as a group using the standard incentive systems and review processes of the day, can produce grossly inflated findings that lend themselves to the appearance of an accumulated body of evidence for an idea when, by definition, it shouldn’t exist. That should be more than troubling. It should be a wakeup call. Our system is more than broken. It is spewing pollution into the scientific environment at an alarming rate.

This is why effect sizes are important. Knowing that the true effect size of sequential ego depletion studies is a d of .08 leads you to conclude that:

1. Most prior research on the sequential task approach to ego depletion is so problematic that it cannot and should not be used to inform future research. Are you interested in those moderators or boundary mechanisms of ego depletion? Great, you are now proposing to see whether your new condition moves a d of .08 to something smaller. Good luck with that.

2. New research on ego depletion is out of reach for most psychological scientists unless they participate in huge multi-lab projects like the Psychological Science Accelerator.

3. Our field is capable of producing huge numbers of published reports in support of an idea that are grossly inaccurate.

4. If someone fails to replicate one of my studies, I can no longer point to dozens, if not hundreds of supporting studies and confidently state that there is a lot of backing for my work.

5. As has been noted by others, meta-analysis is fucked.

And don’t take this situation as anything particular to ego depletion. We now have reams of studies that either through registered replication reports or meta-analyses have shown that the original effect sizes are inflated and that the “truer” effect sizes are much smaller. In numerous cases, ranging from GxE studies to ovulatory cycle effects, the meta-analytic estimates, while statistically significant, are conspicuously smaller than most if not all of the original studies were capable of detecting. These updated effect sizes need to be weighed heavily in research going forward.

In closing, let me point out that I say these things with no prejudice against the idea of ego depletion. I still like the idea and still hold out a sliver of hope that the idea may be viable. It is possible that the idea is sound and the way prior research was executed is the problem.

But, extrapolating from the cumulative meta-analytic work and the registered replication projects, I can’t avoid the conclusion that the effect size for the standard sequential paradigms is small. Really, really small. So small that it would be almost impossible to realistically study the idea in almost any traditional lab.

Maybe the fact that these paradigms no longer work will spur some creative individuals on to come up with newer, more viable, and more reliable ways of testing the idea. Until then, the implication of the effect size is clear: Steer clear of the classic experimental approaches to ego depletion. And, if you nonetheless continue to find value in the basic idea, come up with new ways to study it; the old ways are not robust.

Brent W. Roberts

* p < .05: They failed.  At the time, I chalked it up to my lack of expertise.  And that was before it was popular to argue that people who failed to replicate a study lacked expertise.

** p < .01: See “personality coefficient” Mischel, W. (2013). Personality and assessment. Psychology Press.

*** p < .005: that’s a correlation of .04, but who’s comparing effect sizes??

**** p < .001: “I’m special, so I can ignore effect sizes—look, small effect sizes—I can ignore these because I’m a theoretician. I’m still special”

Posted in Uncategorized | Leave a comment

Making good on a promise

At the end of my previous blog “Because, change is hard“, I said, and I quote: “So, send me your huddled, tired essays repeating the same messages about improving our approach to science that we’ve been making for years and I’ll post, repost, and blog about them every time.”

Well, someone asked me to repost their’s.  So here is it is: http://www.nature.com/news/no-researcher-is-too-junior-to-fix-science-1.21928.  It is a nice piece by John Tregoning.

Speaking of which, there were two related blogs posted right after the change is hard piece that are both worth reading.  The first by Dorothy Bishop is brilliant and counters my pessimism so effectively I’m almost tempted to call her Simine Vazire: http://deevybee.blogspot.co.uk/2017/05/reproducible-practices-are-future-for.html

And if you missed it James Heathers has a spot on post about the New Bad People: https://medium.com/@jamesheathers/meet-the-new-bad-people-4922137949a1


Posted in Uncategorized | Leave a comment

Because, change is hard

I reposted a quote from a paper on twitter this morning entitled “The earth is flat (p > 0.05): Significance thresholds and the crisis of unreplicable research.” The quote, which is worth repeating, was “reliable conclusions on replicability…of a finding can only be drawn using cumulative evidence from multiple independent studies.”

An esteemed colleague (Daniël Lakens @lakens) responded “I just reviewed this paper for PeerJ. I didn’t think it was publishable. Lacks structure, nothing new.”

Setting aside the typical bromide that I mostly curate information on twitter so that I can file and read things later, the last clause “nothing new” struck a nerve. It reminded me of some unappealing conclusions that I’ve arrived at about the reproducibility movement that lead to a different conclusion—that it is very, very important that we post and repost papers like this if we hope to move psychological science towards a more robust future.

From my current vantage, producing new and innovative insights about reproducibility is not the point. There has been almost nothing new in the entire reproducibility discussion. And, that is okay. I mean, the methodologists (whether terroristic or not) have been telling us for decades that our typical approach to evaluating our research findings is problematic. Almost all of our blogs or papers have simply reiterated what those methodologists told us decades ago. Most of the papers and activities emerging from the reproducibility movement are not coming up with “novel, innovative” techniques for doing good science. Doing good science necessitates no novelty. It does not take deep thought or creativity to pre-register a study, do a power analysis, or replicate your research.

What is different this time is that we have more people’s attention than the earlier discussions. That means, we have a chance to make things better instead of letting psychology fester in a morass of ambiguous findings meant more for personal gain than for discovering and confirming facts about human nature.

The point is that we need to create an environment in which doing science well—producing cumulative evidence from multiple independent studies—is the norm. To make this the norm, we need to convince a critical mass of psychological scientists to change their behavior (I wonder what branch of psychology specializes in that?). We know from our initial efforts that many of our colleagues want nothing to do with this effort (the skeptics). And, these skeptical colleagues count in their ranks a disproportionate number of well-established, high status researchers who have lopsided sway in the ongoing reproducibility discussion. We also know that another critical mass is trying to avoid the issue, but seem to be grudgingly okay with taking small steps like increasing their N or capitulating to new journal requirements (the agnostics). I would even guess that the majority of psychological scientists remain blithely unaware of the machinations of scientists concerned with reproducibility (the naïve) and think that it is only an issue for subgroups like social psychology (which we all know is not true). We know that many young people are entirely sympathetic to the effort to reform methods in psychological science (the sympathizers). But, these early career researchers face withering winds of contempt from their advisors or senior colleagues and problematic incentives for success that dictate they continue to pursue poorly designed research (e.g., the prototypical underpowered series of conceptual replication studies, in which one roots around for p < .05 interaction effects).

So why post papers that reiterate these points? Even if those papers are derivative or maybe not as scintillating as we would like? Why write blogs that repeat what others have said for decades before?

Because, change is hard.

We are not going to change the minds of the skeptics. They are lost to us. That so many of our most highly esteemed colleagues are in this group simply makes things more challenging. The agnostics are like political independents. Their position can be changed, but it takes a lot of lobbying and they often have to be motivated through self-interest. I’ve seen an amazingly small number of agnostics come around after six years of blog posts, papers, presentations, and conversations. These folks come around one talk, one blog, or one paper at a time. And really, it takes multiple messages to get them to change. The naïve are not paying attention, so we need to repeat the same message over and over and over again in hopes that they might actually read the latest reiteration of Jacob Cohen. The early career researchers often see clearly what is going on but then must somehow negotiate the landmines that the skeptics and the reproducibility methodologists throw in their way. In this context, re-messaging, re-posting, re-iterating serves the purpose to  create the perception that doing things well is supported by a critical mass of colleagues.

Here’s my working hypothesis. In the absence of wholesale changes to incentive structures (grants, tenure, publication requirements at journals), one of the few ways we will succeed in making it the norm to “produce cumulative evidence from multiple independent studies” is by repeating the reproducibility message. Loudly. By repeating these messages we can drown out the skeptics, move a few agnostics, enlighten the naïve, and create an environment in which it is safe for early career researchers to do the right thing. Then, in a generation or two psychological science might actually produce, useful, cumulative knowledge.

So, send me your huddled, tired essays repeating the same messages about improving our approach to science that we’ve been making for years and I’ll post, repost, and blog about them every time.

Brent W. Roberts

Posted in Uncategorized | 11 Comments